 En
EnU.S. Tariff Axes Set To Swing Leads Auto and Steel Imports to Rush In
The U.S. import boom showed no signs of letting up in May. Panjiva data shows seaborne shipments increased 4% on a month earlier. That was the third straight month of growth and may lead to continued expansion in the trade deficit. India led the way with a 16% jump in shipments to the U.S., while imports from China climbed 7%. That may prove contentious given May’s trade data will be published just 10 days before the 100 day consultation period between the U.S. and Chinese governments ends. Among tariff-sensitive sectors, automotive imports jumped 22% despite a slowdown in auto sales. Steel volumes improved by 18%, with shippers appearing to be trying to preempt the result of the “section 232” review due at the end of June. At the current rate total U.S. imports for 2017 could rise 3% to hit a new high of 11.5 million shipments.
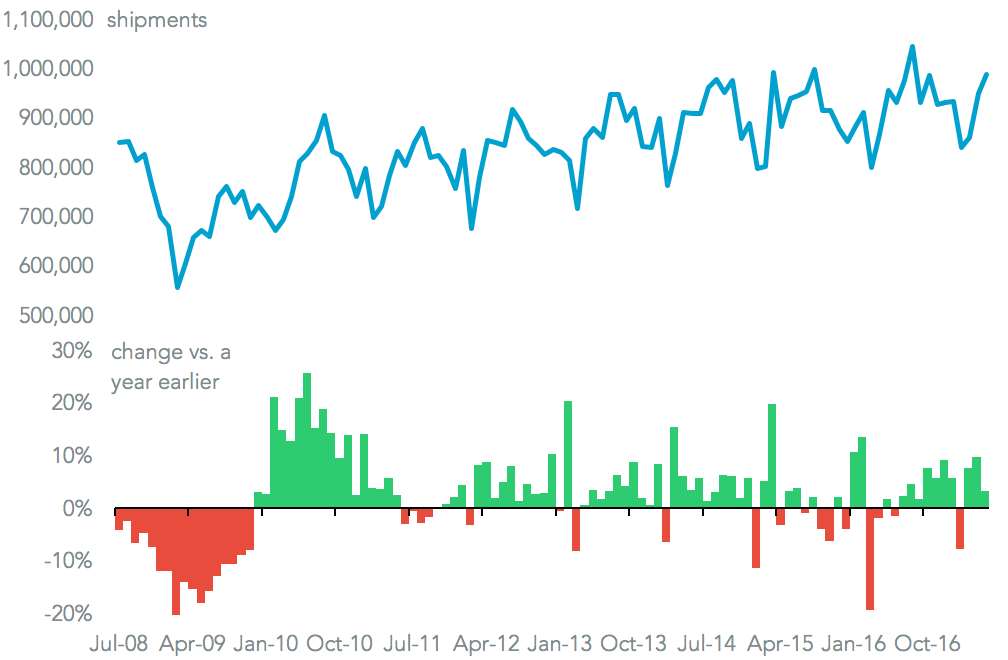
The import boom being experienced by the United States showed no signs of letting up in May. Panjiva data shows that, on a preliminary basis, seaborne import shipments increased 3.9% on a year earlier. That was the third straight month of growth, and the 10th increase in the past 12 months. A further expansion in imports would follow a 9% expansion in the value of imports in April, which in turn resulted in a 24% rise in the trade deficit, as outlined in Panjiva research of June 5.
Source: Panjiva
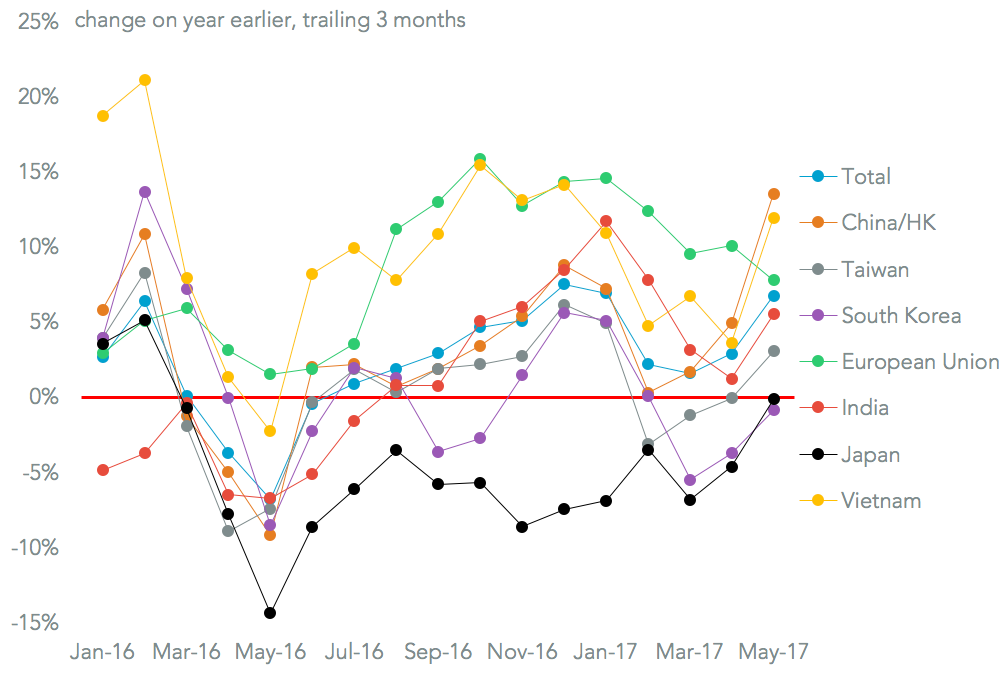
Segmenting imports by country of origin shows the fastest growth among the largest shippers to the U.S. came from India with a 15.5% growth rate. That was the fastest rate of growth since June 2015. That is notable as India is one of the few countries that has not yet had a heads-of-state meeting with President Donald Trump so far.
Shipments from China continued to expand, though the 6.50% growth rate was a marked slowdown from the previous two months. The expansion may prove counterproductive as China and the U.S. round out their first 100 days of trade talks on July 16 – the full May trade deficit data will be released 10 days earlier. Meanwhile China was singled out in comments about the most recent trade deficit report by Commerce Secretary Wilbur Ross.
Exports from the European Union may finally be slowing down. Imports increased by 1.42%. That was the 17th straight month of growth, but the slowest rate since May 2016. Such a slow-down may ease the pressure in tariff-deficit politics between the U.S. and the EU, though talks to revive the TTIP trade deal seem unlikely anyway.
Source: Panjiva
The potential “race to beat tariffs” seen in imports at the product level in April appears to have continued in May. Imports of autos and parts increased for a second month, and accelerated to 22.0% higher than a year earlier. That came despite a continued slowdown in the sales of imported vehicles. It seems increasingly likely that inventories will build up, leading to discounts later in the year. Elsewhere in consumer durables, furniture imports increased 12.0% – a slower rate than the previous two months but still significant and the result of a buoyant employment market.
Among the industrials, importers of iron and steel are clearly trying to beat any broad-based tariffs resulting from the “section 232” review of the industry. That review is due to be completed by the end of June. Imports increased by 17.9% on a shipment basis.

Source: Panjiva
Looking ahead, in the previous six years around 40% of full year shipments had been completed by the end of May. Taking the year-to-date performance that would suggest seaborne imports for 2017 overall could rise 3.3% on a year earlier to a new record of 11.5 million shipments.

Source: Panjiva