 En
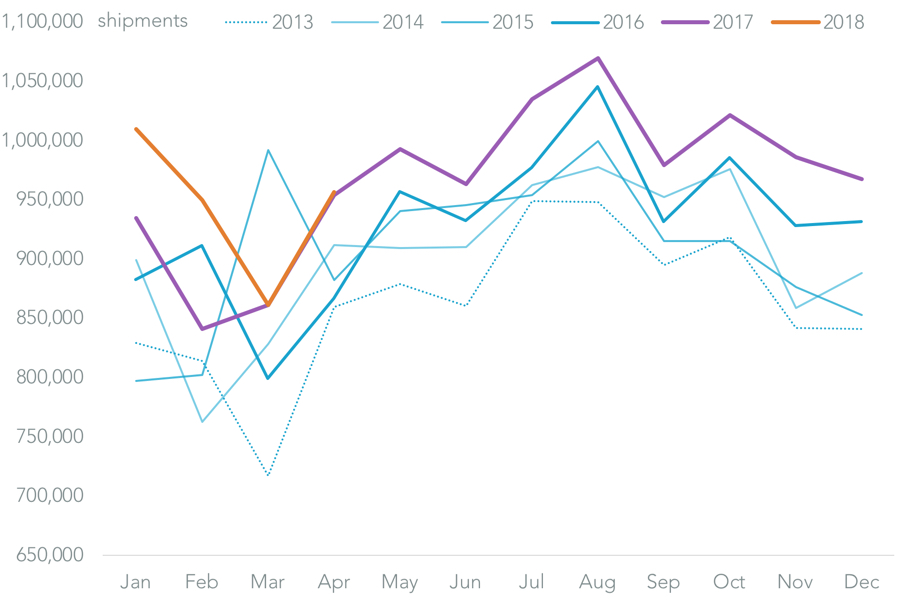
En#1 Expeditors and UPS become more conservative (May 9) Freight forwarders operating on U.S. inbound seaborne routes faced a drop in traffic from China in April, making a disciplined approach to competition more important than ever. Seven of the 12 forwarders suffered a drop in profitability in 1Q (more on that below) perhaps leading UPS (volumes down 25% on a year earlier in April) and Expeditors (7% lower) to be more circumspect. Asia-specialist shippers were more aggressive including Orient Express (up 29% in April, with 61% of volumes from China in the past three months) and Kerry (10% higher, 58% from China).
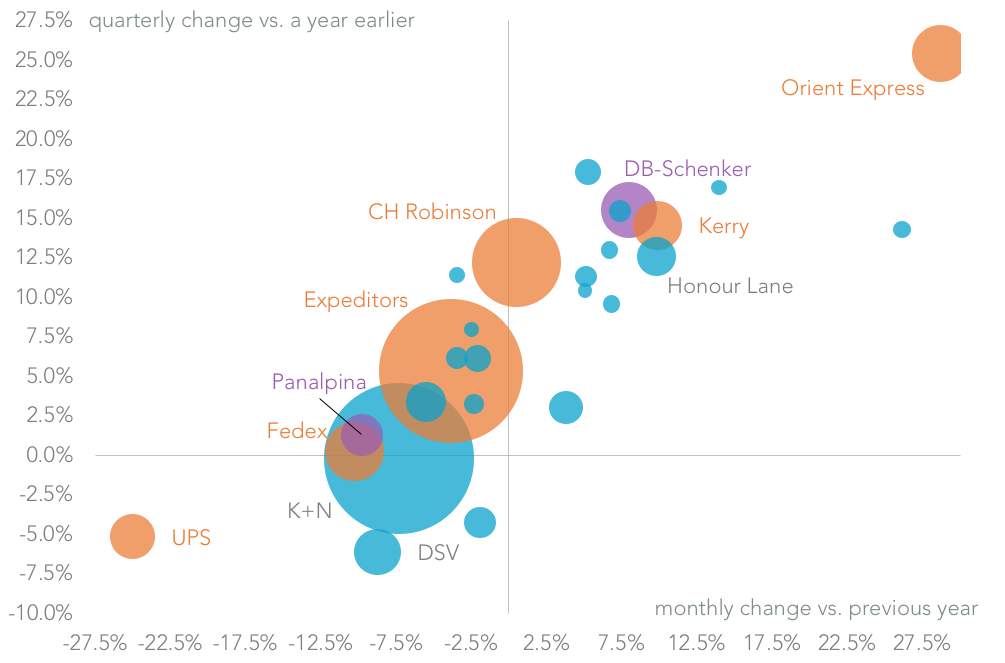
Source: Panjiva
#2 Iran sanctions to hurt soybean farmers and Italians (May 8) As expected President Trump reimposed sanctions on Iran. Oil prices rose above $70 per barrel, pushing bunker fuel prices up 13% year-to-date and squeezing container-line profits. U.S. exports to Iran rose 5% in the 12 months to March 31 and were led by soybeans and wood-pulp, which may therefore lose out once sanctions are imposed in around 90 days. The bigger effect will be financial restrictions for companies wanting to work in both the EU and the U.S. That may have a significant impact on companies in the EU (19% of all Iranian trade in 2017, led by Italy) and India (8%).
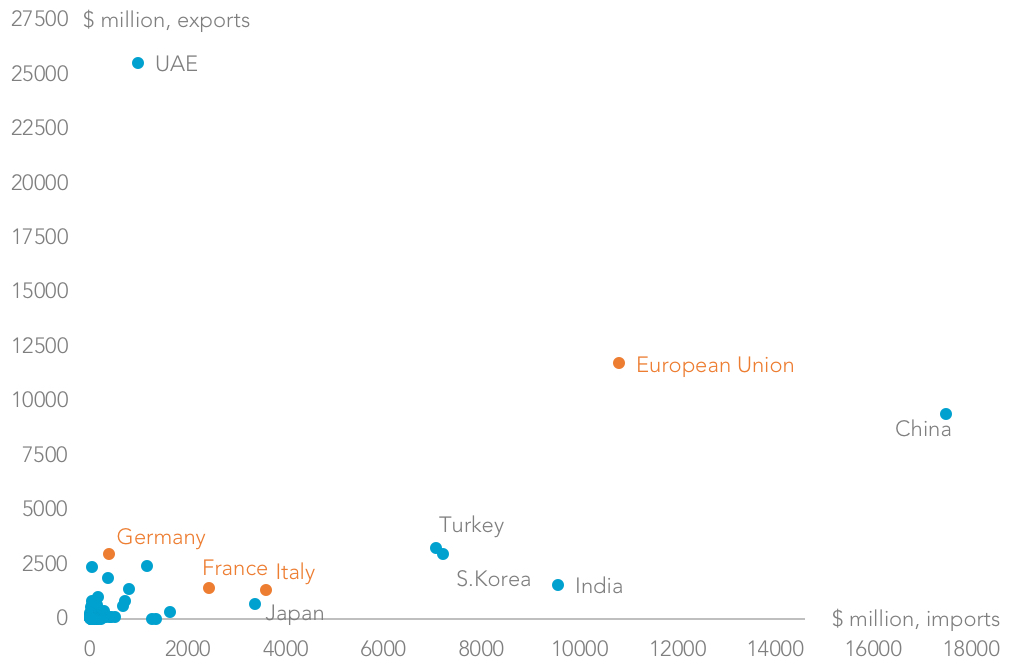
Source: Panjiva
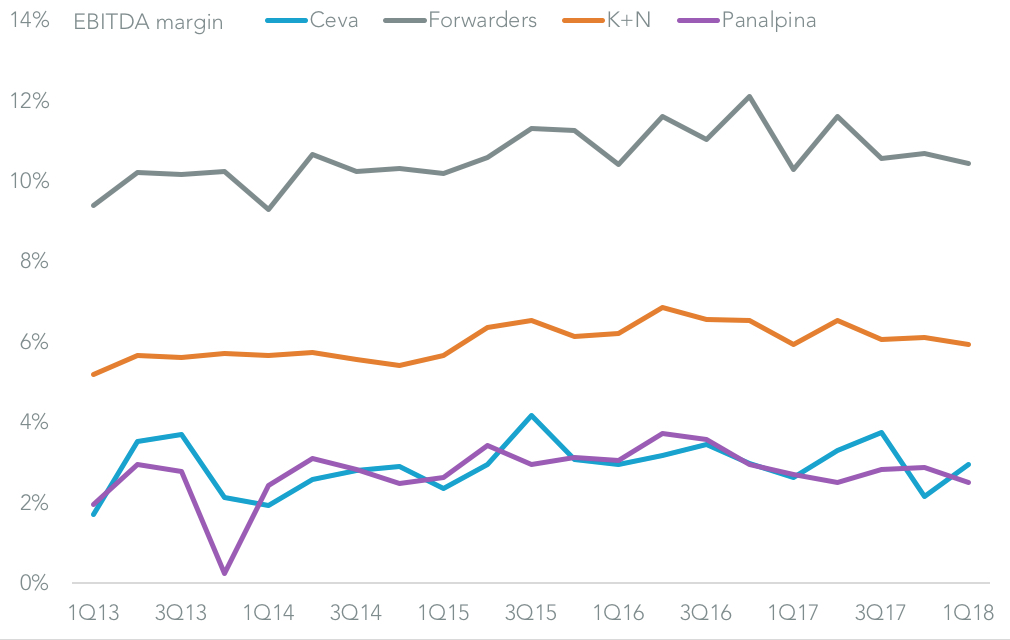
#3 CH Robinson pays the price for competing (May 3) As mentioned above the profitability of the freight forwarders fell in the first quarter. That was typified by CH Robinson whose EBITDA margin fell to 5.5% from 6.4% a year earlier and was below estimates of 5.8%. An aggressive approach to market share – shown by a 13% rise in U.S. marine inbound volumes vs. 7% for the industry – was one cause. Additionally there was a rise in driver costs in the U.S. surface business. The costs of aggressive competition can be seen across the sector, with 1Q EBITDA margins likely have fallen to 9.9% from 10.5% a year earlier. That would be the lowest level since 1Q 2014.
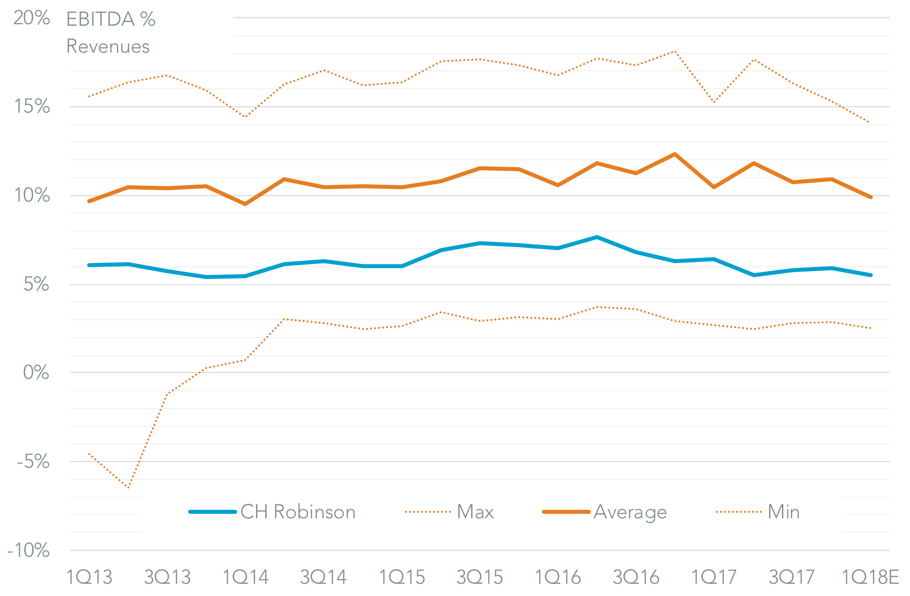
Source: Panjiva
#4 Trump kicks the steel can down the road (May 1) American trade policy went through a series of swings during May, starting with an extension of temporary exemptions from section 232 metals duties for the EU and five countries to June 1. We identified the EU as being the most difficult to negotiate with noting it accounted for 16% of U.S. imports of the metals covered and that it already had $2.4 billion of goods identified for retaliation. Ultimately though a deal to cut duties in the automotive sector – where America’s deficit with the EU is 4.4x its deficit in metals – was not forthcoming and duties were applied at the end of the month.
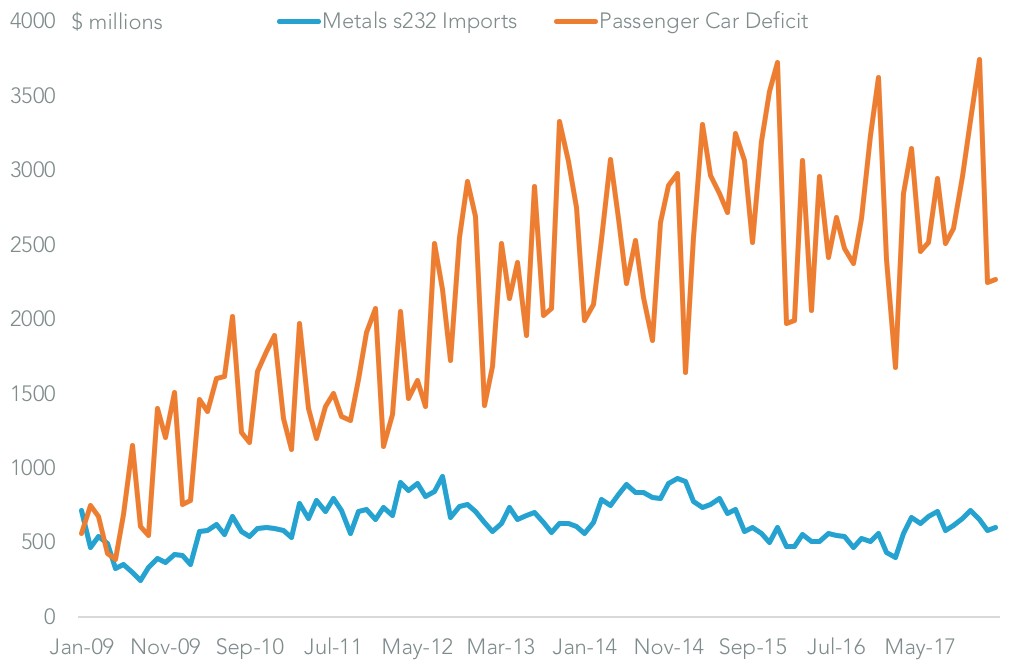
Source: Panjiva
#5 The magnificent seven ride home with little to show (May 7) America’s trade policy with China also went through a series of turns, starting off with a visit by seven senior U.S. officials to China that did not appear to have made much progress. We found four reasons why including: a focus on winning a $200 billion package of increased Chinese imports from America; a desire on China’s side to achieve that through importing more semiconductors (total imports worth $239 billion in the past year); troubles in realigning purchases from other countries; and U.S. restrictions on telecoms equipment exports from China (49% of America’s total). More on what happened next can be found at #10.

Source: Panjiva
#6 Ceva Logistics claws its way to higher profits (May 15) Ceva reported maiden 1Q results including a 12% surge in revenues (the fastest in at least four years) and an increased in its EBITDA margin to 3.0% from 2.6% a year earlier. That’s an encouraging sign of discipline straight after its IPO. Management want to increase that margin to 4% – closer to K+N’s level but well below the sector average – which will require further cost control. A closer cooperation with CMA-CGM (which now owns 25% of Ceva) in integrated service offerings may be another route to growth.
Source: Panjiva
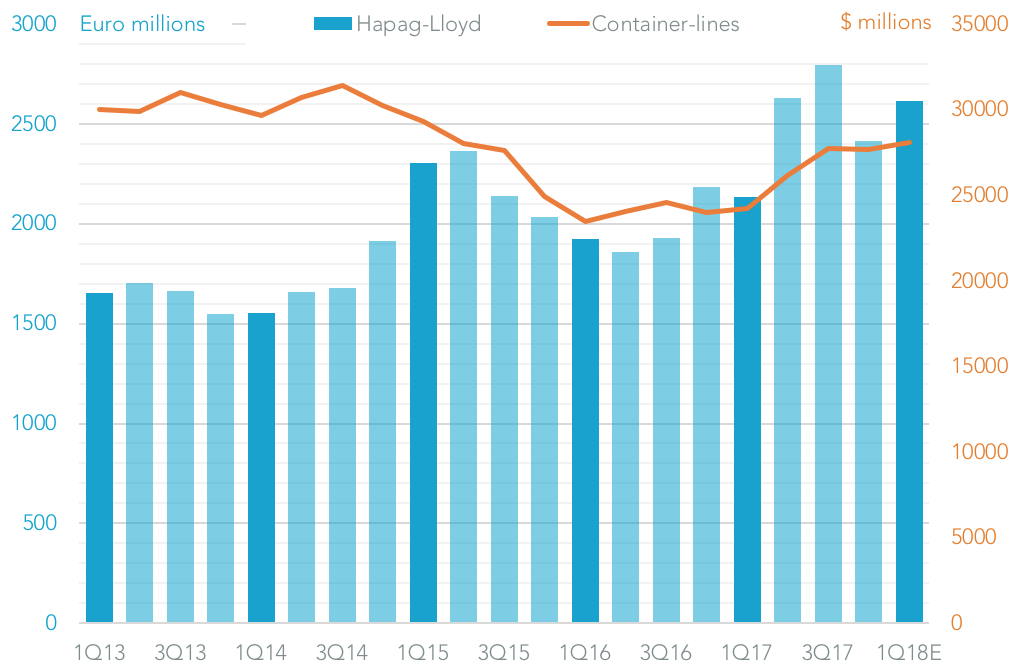
#7 MSC hits the emergency button (May 21) The latter half of May was characterized by a series of fuel- and handling-cost surcharge increases by the container-lines. MSC got the ball rolling and was followed by Maersk and CMA-CGM. MSC may partly be a victim of its own success after U.S.-inbound volumes reached a new record in April even while bunker fuel costs rose and container-rates were largely unchanged. Nonetheless timing matters. The 3Q delivery season has historically accounted for 27% of annual shipments to the U.S. while July arrivals are due to depart Asian ports in a few week’s time.
Source: Panjiva
#8 Hapag-Lloyd schools ONE (May 14) Before the fuel rate furore got going Hapag-Lloyd had reported an increase in profitability (EBITDA margin) to 8.4% from 5.8% a year earlier. That was partly due to disciplined price increases (average rates up 7%) and careful integration of UASC. The latter may provide a lesson to Ocean Network Express which struggled during its first month of operations.
Source: Panjiva
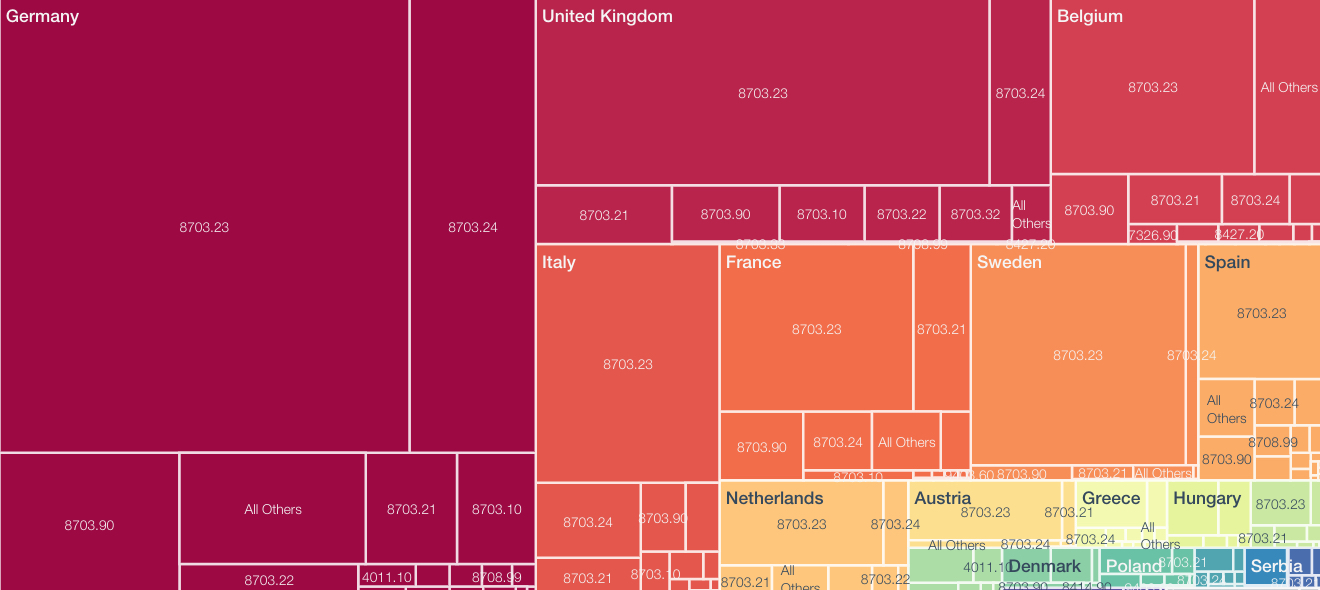
#9 Daimler set to drive through duties (May 14) Arguably the biggest surprise of the month in trade policy was the decision by the Trump administration to launch a section 232 (“national security”) review of the automotive industry. President Trump trailed that with calling for a 20% duty on all imported vehicles. Exporters are clearly expected tariffs with EU automotive exports to the U.S. in 1Q up 9% on a year earlier. That accelerated to a 21% rate of growth in April alone. Germany has the most to lose in absolute terms as it accounts for 40% of shipments. Yet, German exporters including Daimler, BMW and VW could increase production from their North American factories to compensate.
Source: Panjiva
#10 Beans-and-gas deal the secret to peace (May 21) A second round of inter-ministerial talks between China and the U.S. appeared to bury the tariff hatchet with China committing to buying more U.S. agricultural and energy products. U.S. exports of soybeans (the most likely focus for increased Chinese purchases) fell 12% in 1Q 2018 including a 24% slump on a year earlier in China-bound shipments. There’s plenty of room for expansion given China’s total imports were worth $40 billion in 2017. Increased purchases of oil and LNG may also have been discussed. A third round of discussions at month end, however, failed to deliver firm details and the U.S. government raised the prospect of announcing wide-ranging duties on Chinese exports as at June 15.
Source: Panjiva


