 En
EnPresident Donald Trump has signed a Presidential Memorandum authorizing the Commerce Department to carry out a broad-based review of steel imports. This is being done under the auspices of section 232 of the 1962 Trade Expansion Act. A section 232 report will determine whether steel imports broadly have worked to the detriment of the American economy and workers.
From a process perspective a report can take up to 270 days to deliver, with the President taking another 90 days to review the results and take action. Given the President’s recent comments regarding the process for NAFTA – as discussed in Panjiva research of April 19, and a desire expressed by Secretary Wilbur Ross to act “expeditiously” a result can be expected sooner than that.
Panjiva analysis of the top 200 U.S. steel (defined by HS-6 code) and its top 10 partners shows the products making the biggest contribution are from the EU, NAFTA, Brazil, South Korea and Russia. High impact product combinations which may attract specific action include: non-alloy semi-finished steel (7207.12) from Brazil and Russia; tin-coated plate (7210.12) from the EU; primary alloy steel (HS 7224.90) from Brazil; ferrochromium (7202.41) from South Africa; and zinc-aluminum coated plate from Taiwan (7210.61).
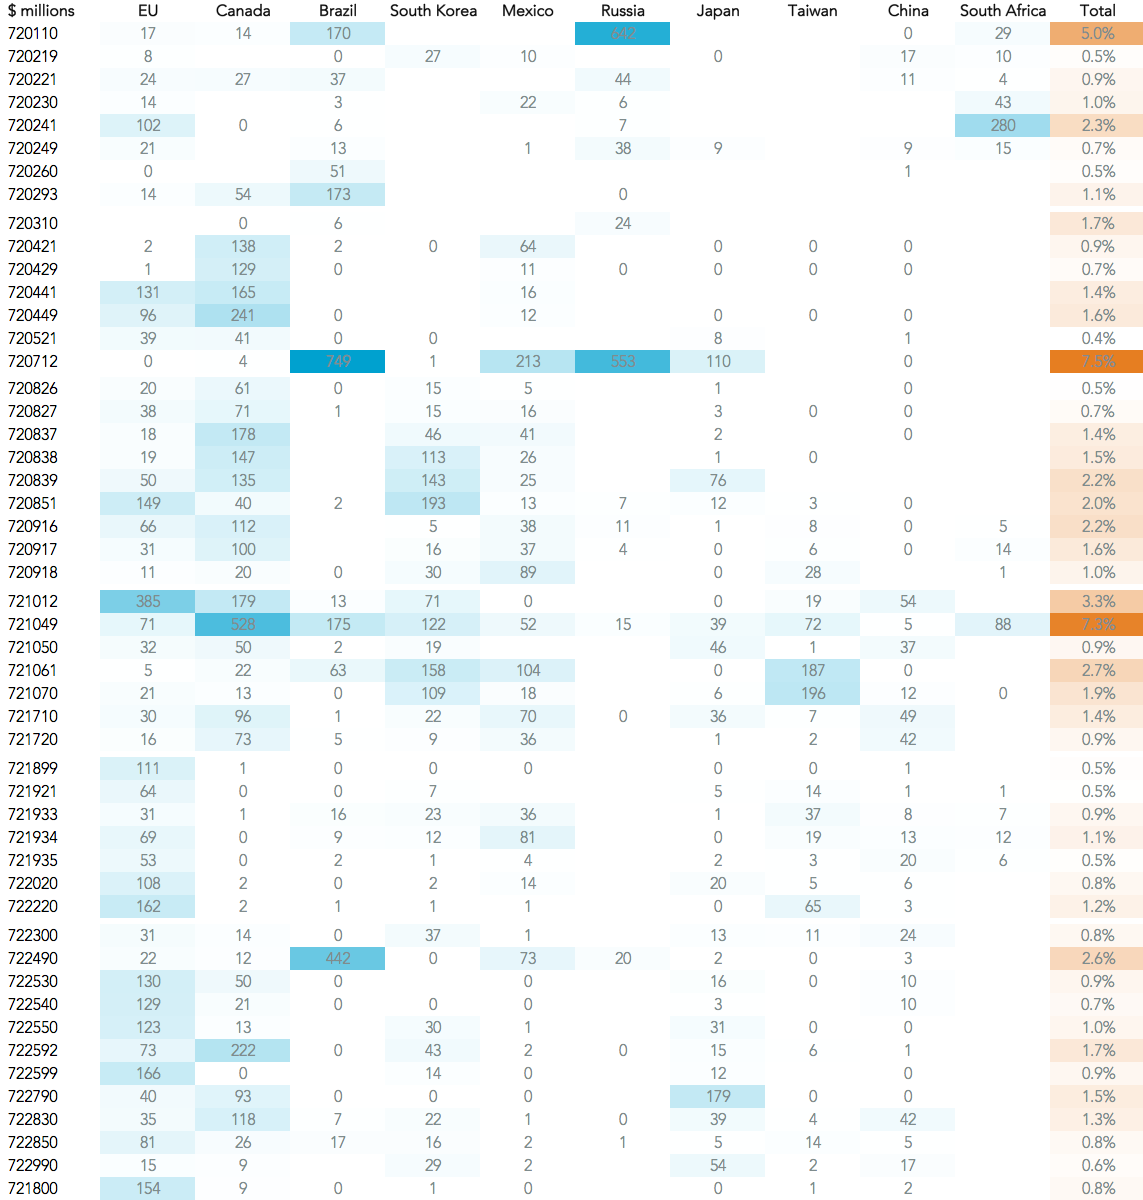
Source: Panjiva
The change over time may also be taken into account, in which case the decline in imports from certain countries, including China (down 60.6%) and Mexico/Canada (27.4%), may be taken into account. Despite that U.S. steel imports increased 19.7% on a year earlier in the three months to February 28 as a result of a resurgence in shipments from Brazil and Russia.
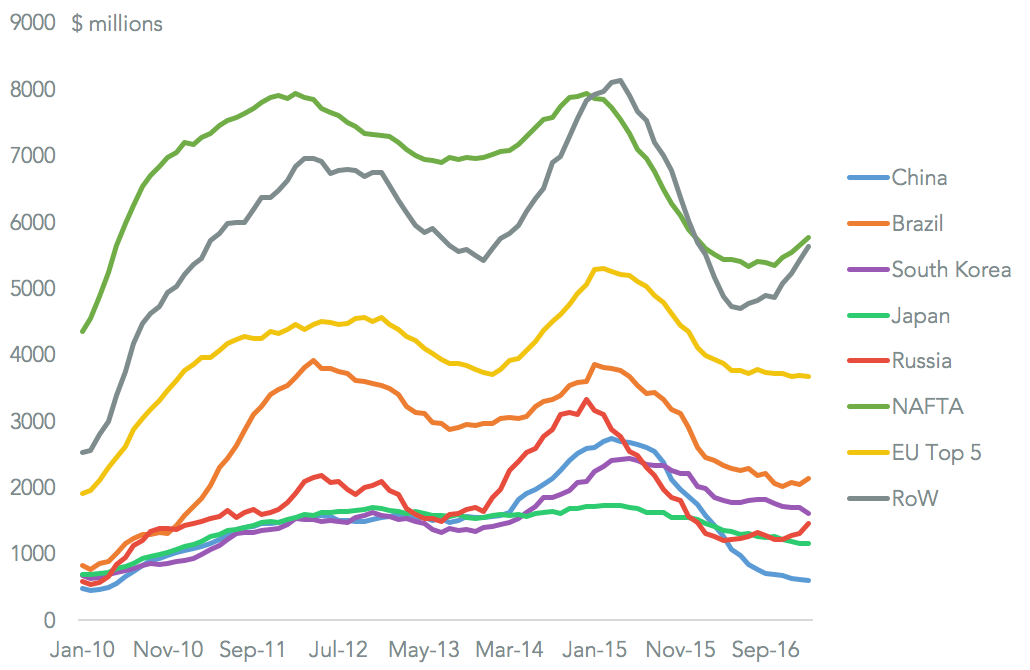
Source: Panjiva


