 En
EnThe non-vessel-owning common carriers (NVOCCs) generally managed to keep up with the market in terms of U.S.-inbound, seaborne traffic handling in February. There was a general decline in shipments, with a 7.9% drop compared to a year earlier. This was partly due to there being one less calendar day as well as the lunar new year holiday, as discussed in Panjiva research of March 7. It was also likely the result of slower shipments by manufacturers and buyers concerned about new taxes or tariffs.
Panjiva data shows that 19 of the top 50 NVOCCs experienced a drop in shipments handled of more than 7.9%. The two leading carriers, Expeditors and CH Robinson’s Christal, saw a 10.2% and 14.1% drop respectively, while their immediate competitors did much better – for example Deutsche Post DHL’s Danmar only fell 2.0%. The stand-out was DSV Ocean Transport which jumped 46.1%, though that includes the impact of the UTi acquisition completed in early 2016 counting for a full year.

Source: Panjiva
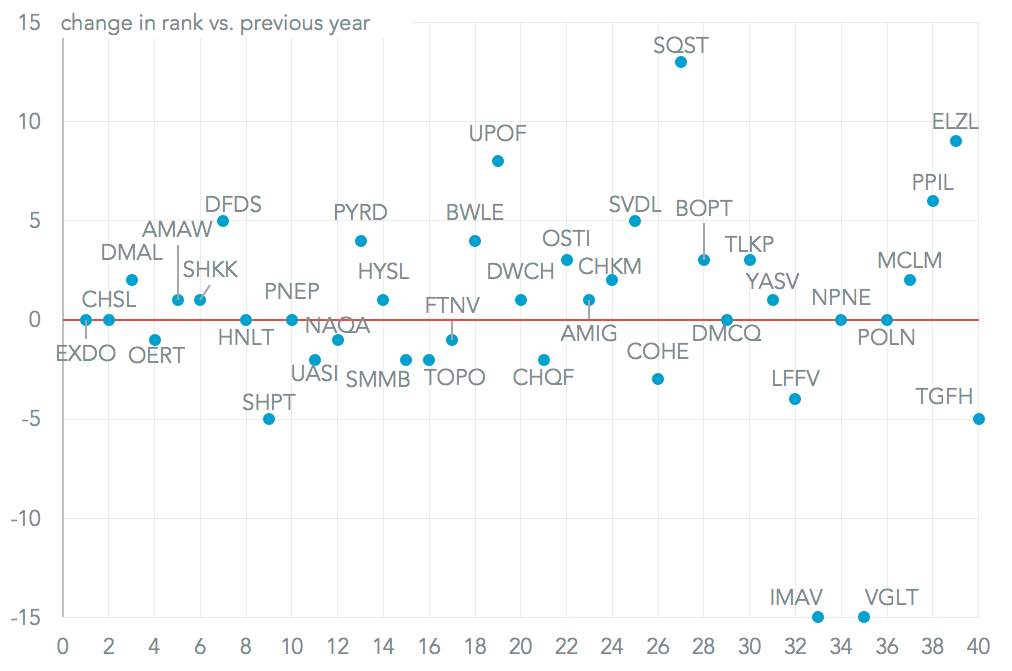
The acquisition allowed Danmar to jump to third place among the NVOCCs in February from fifth a year earlier and DSV to reach seventh from twelfth. This came in part at the expense of Orient Express and in particular Shipco, which dropped five places to ninth. That may reflect an increased focus on other routes, for example Shipco has announced new routes from Hong Kong to Panama, Singapore-to-Yantian, Shanghai to DP World Yarimca and Cebu-to-Shanghai in the past six weeks.
Source: Panjiva


