 En
EnThe U.S. trade deficit surged 21.6% higher in September vs. a year earlier to reach $54.02 billion, Panjiva analysis of official data shows. That was the 19th month of expansion since January 2017 and wa largely down to a 17.2% jump in the goods deficit which, at $77.23 billion, was the highest since July 2008.

Source: Panjiva
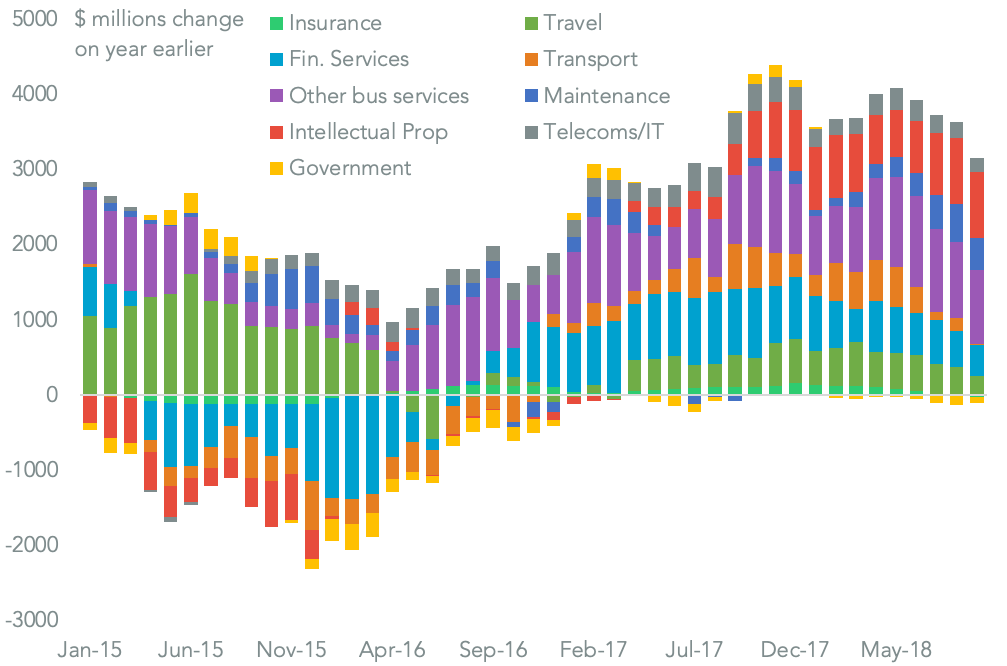
An 8.0% expansion in the services surplus marked a slowdown from 9.4% a month earlier and was largely due to weaker services exports growth. The insurance sector was the main problem area after a 1.4% decline, while financial services grew at the slowest rate since September 2016. Additionally the transport sector (airlines) grew by just 0.1%, the slowest expansion since the sector started to recover in 2016.
Source: Panjiva
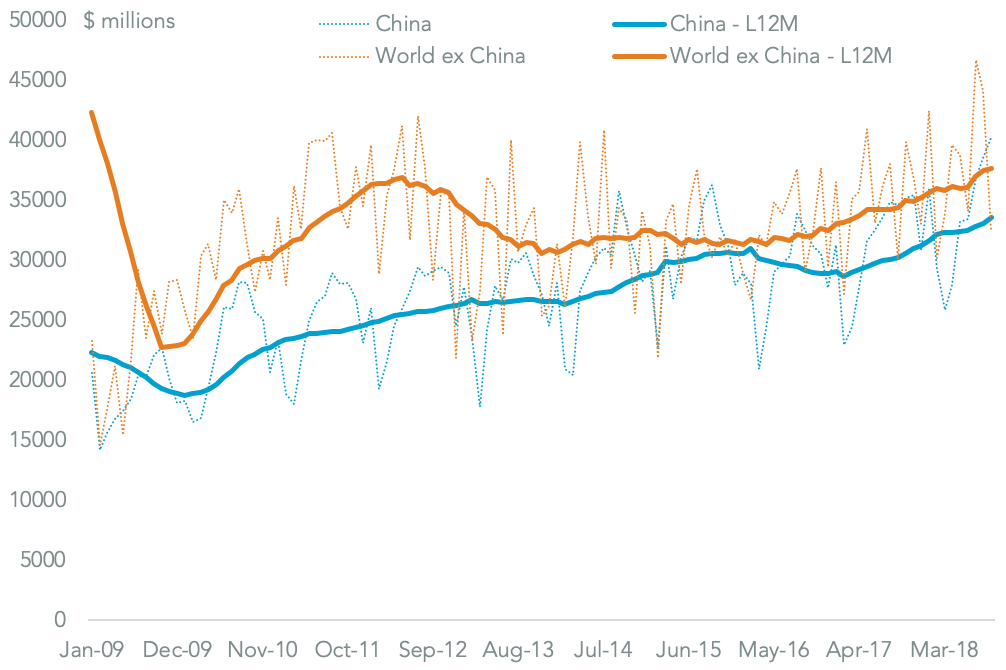
Unsurprisingly the primary driver of the growth in the goods deficit was China with a 16.2% increase compared to a year earlier to reach more than $40 billion for the first time. That was largely down to the impact of a rush to beat duties applied by both sides from September 24, as first shown in seaborne shipments outlined in Panjiva research of Oct. 17. As a consequence China accounted for 55.2% of the overall U.S. trade deficit.
Source: Panjiva
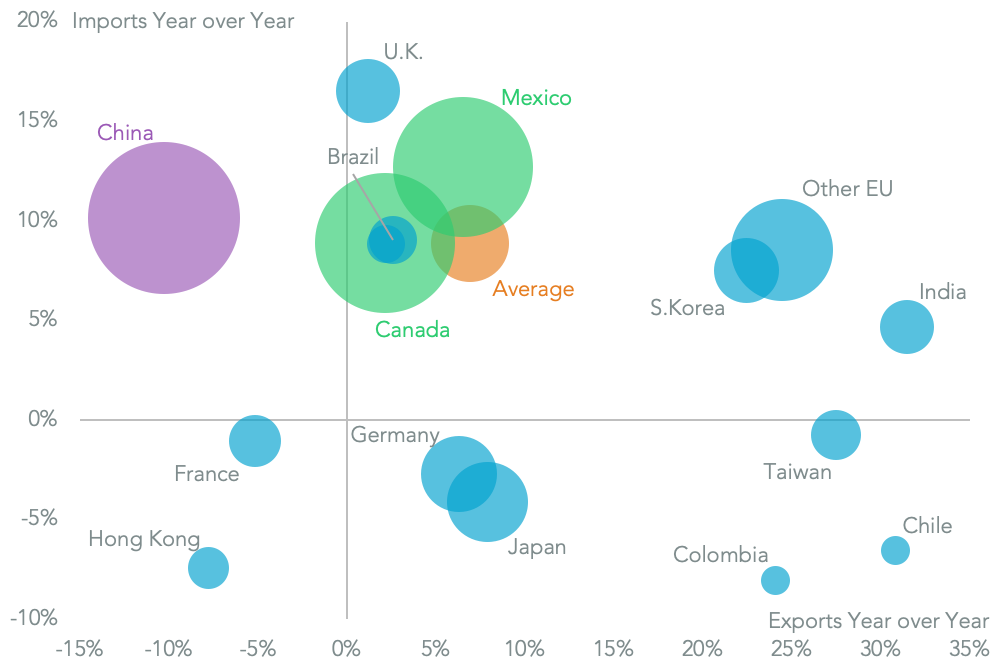
At the headline level it appears that China’s retaliatory duties on U.S. exports have had a more negative effect than vice versa. U.S. exports to China fell 10.3% on a year earlier whereas U.S. imports from China surged 10.1% higher. The only other significant drop in exports was to France (5.2%) and OPEC countries (9.4%). In terms of North America the outlined USMCA deal has yet to have an effect on trade, with U.S. exports to Mexico and Canada up by 4.1% whereas imports climbed 10.9% higher.
Source: Panjiva


