 En
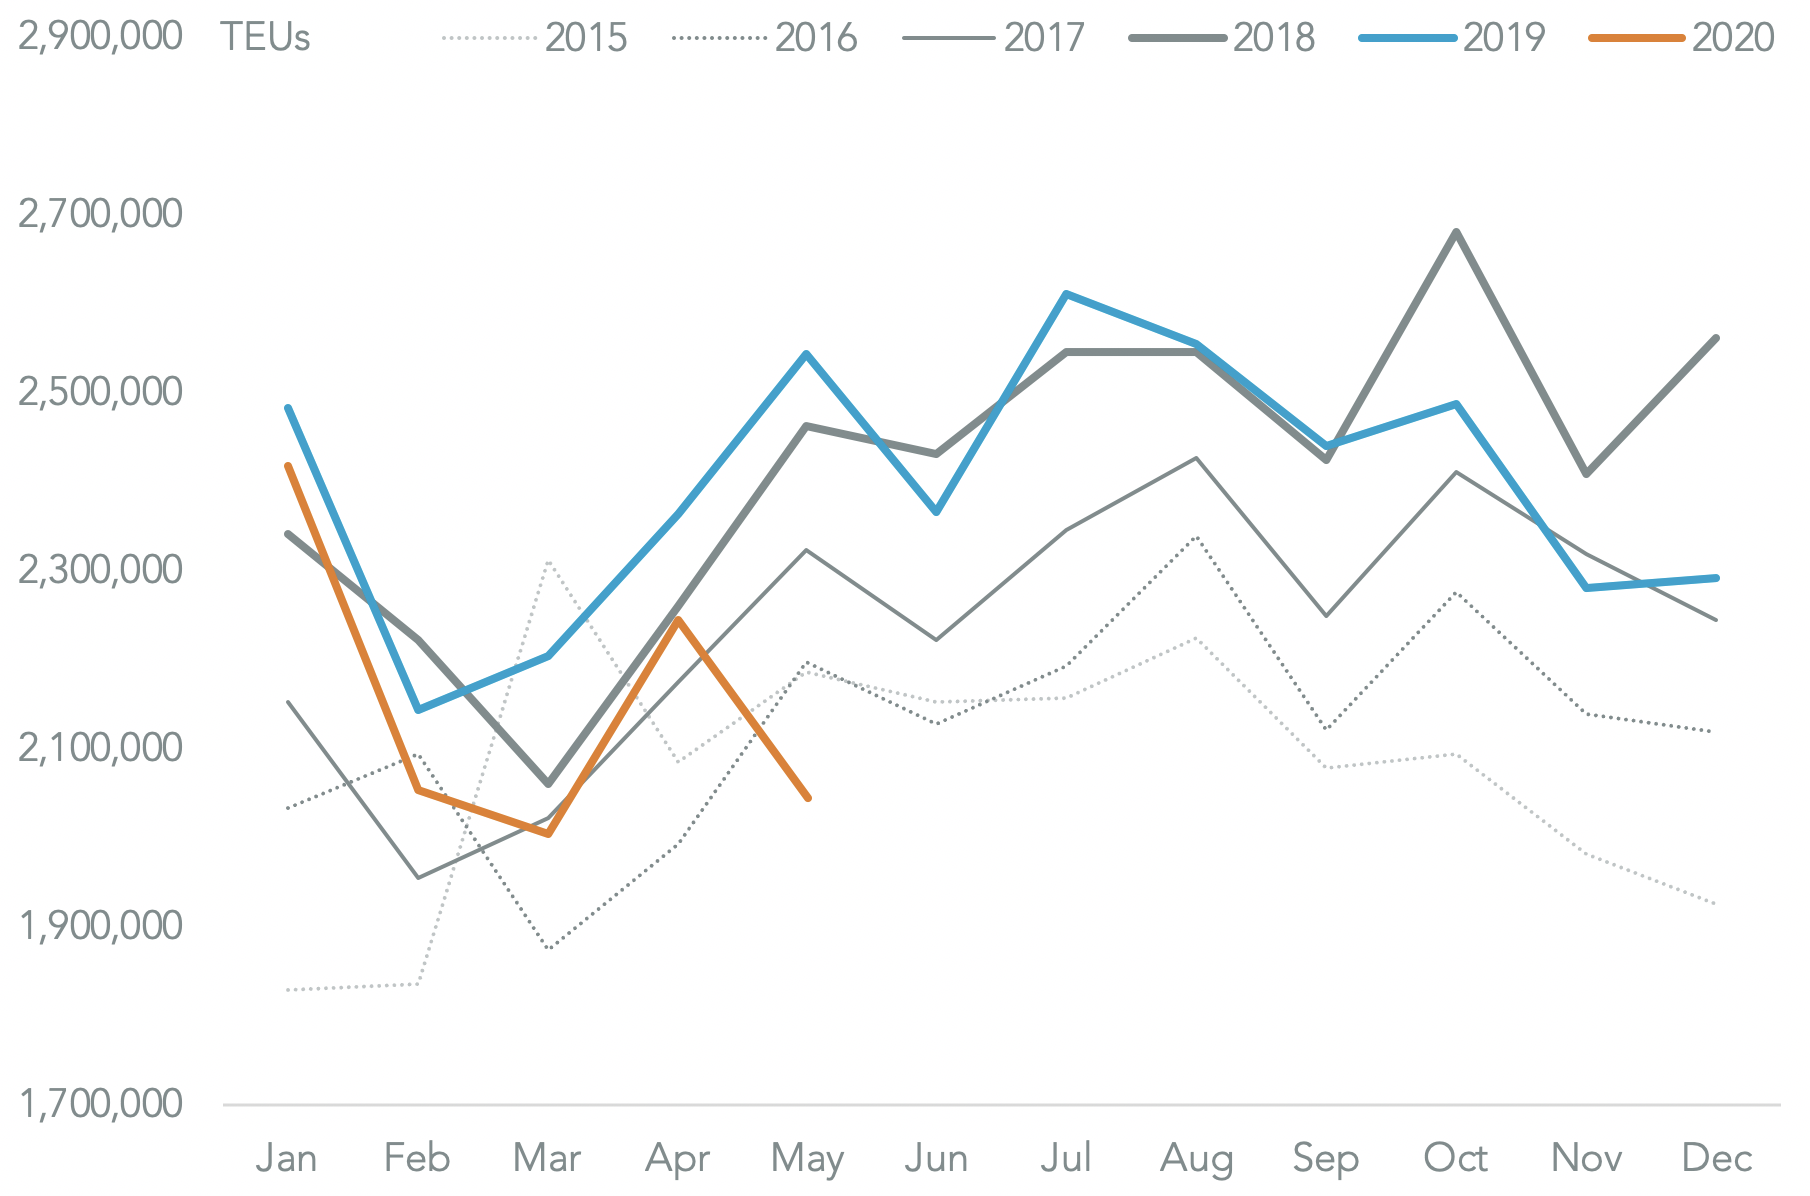
EnU.S. international trade activity likely continued its descent in May. Panjiva’s U.S. seaborne import data shows that all shipments fell by 7.4% year over year in May, with containerized freight falling by 19.7%. The latter was the fastest rate since February 2009.
The differential between total and containerized shipments is likely the result of continued small-scale, less-than-container load, shipments as a result of the growth of e-commerce during the COVID-19 pandemic.
Importantly it also marks a downturn in absolute terms of 9.0% versus April while in the prior 10 years there was a 6.0% increase on average. That suggests a slow start to the peak shipping season and the note of caution struck by many of the container-lines as outlined in Panjiva’s research of June 9.
Source: Panjiva
The drop in imports is as much demand-led as supply-led. Imports from China, where industry has been reopened for all of April and May, still dropped by 15.8% year over year in May. That was only slightly slower than the 18.1% rate average in the three months to April 30. Similarly imports from Vietnam fell by 13.7%.
Sourcing from other countries is very much about local market conditions though with shipments from India down by 66.1% – dragging Asia ex-China in total 25.8% lower – while shipments from Europe fell by 18.3%.

Source: Panjiva
Perhaps unsurprisingly given the retail closures there was a slump in consumer discretionary goods. Imports linked to the automotive industry slumped 68.7% lower reflecting both lower sales and the complexity of parts supply chains that will reopen at very different rates globally.
Shipments of furniture and apparel dropped by 34.3% and 48.7% respectively due to store closures. Retailers are left with difficult decisions to make heading into peak season – whether to assume business as usual or take a more conservative stance.
Imports linked to industrial activity did not fall by as much with imports of iron and steel down by 19.1%, machinery and electronics down by 8.5% and chemicals off by just 1.9%.

Source: Panjiva


