U.S. imports may have experienced a resurgence in growth in September after seaborne shipments climbed 7.3% on a year earlier, Panjiva data shows. As is normally the case the level of shipments was down vs. August though that may have been exacerbated by the impact of Hurricane Florence on east coast ports. Major hurricanes last year included Harvey in August and Irma in September.

Source: Panjiva
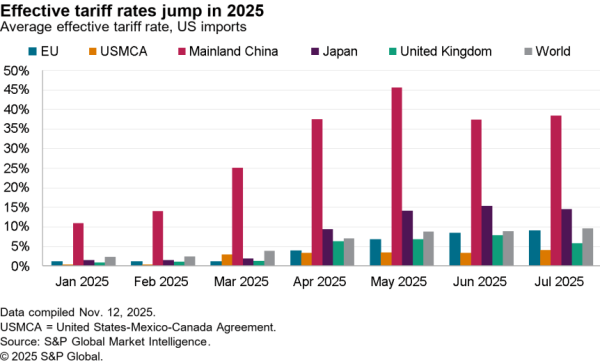
The bigger issue however is the potential impact of the widening trade war between the U.S. and China. As outlined in Panjiva research of September 18 the U.S. applied 10% tariffs to $200 billion of Chinese exports from September 24 following the imposition of tariffs to $50 billion of products across July and August. A surge in shipments from China ahead of the wider range of duties can be seen in the 8.7% jump in September after a 1.0% decline in August vs. a year earlier.
Outside China there were notable accelerations in shipments from India (16.4% higher after a 7.2% rise in the prior three months) and Vietnam (25.4% from 7.4%). The latter may reflect the start in shifts in production by Chinese manufacturers to other, lower tariff jurisdictions.
There was also a 2.8% drop in imports by sea from Mexico after a 17.7% surge in the prior three months. The recent resolution to NAFTA negotiations to create USMCA may herald a return to business-as-usual for cross-border trade.

Source: Panjiva
Among key Chinese exports to the U.S. that became subject to duties in September the most significant gains included home appliances (including microwaves under HS 8516, up 9.8% on a year earlier and refrigerators under HS 8418, up 15.3%) as well as pumping systems (HS 8414, which surged 23.6% higher) and valve systems (HS 8481 which rose 17.4%).

Source: Panjiva
The prospect of duties on autos as a result of the section 232 review of the industry has waned somewhat given ongoing trade discussions with Europe and Japan. Imports of autos and parts rose 8.3% vs. 2.7% in the prior three months, perhaps signalling concerns among manufacturers about the lack of new information in the case.
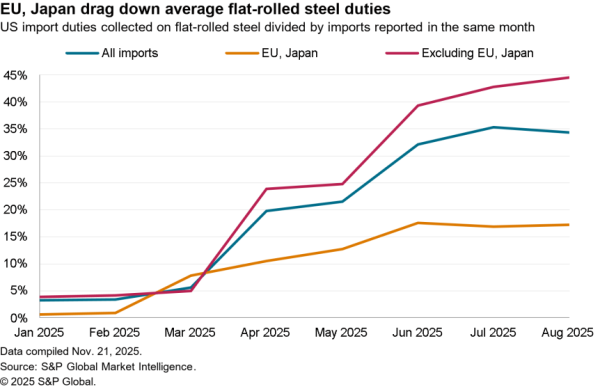
Elsewhere in industrial supply chains growth was relatively modest with capital goods (HS 84/85) up 3.4% vs. 4.8% over the previous three months. A 2.2% increase in shipments of iron and steel is remarkable given the imposition of 25% duties on most imports since June.

Source: Panjiva
Outside of household appliances, demand for consumer goods remains robust. Imports of furniture rose 4.8% (slightly below the prior three months’ 5.5%) while apparel surged 8.9% higher than a year earlier. The determination of retailers to capitalize on the demise of Toys’R’Us to build market share ahead of the holiday season can be seen in a 3.1% rise in imports of toys vs. a 2.3% decline in the prior three months at the start of the peak shipping season. There’s still two months of imports to go before the holiday window closes though.

Source: Panjiva
A resurgence in consumer confidence to the highest September 2000, shown by S&P Global Market Intelligence data, would suggest a drop in demand for imported goods – outwith tariff effects – may be less likely in the rest of the year. Business optimism has declined slightly but is still in firmly positive territory, supporting continued growth in industrial imports.

Source: Panjiva
On a seasonal basis and using prior year’s experience the full year growth in imports could reach 4.9% for the full year. Indeed there would need to be a 16.4% drop in imports year-over-year in the fourth quarter to bring the full year to an unchanged level. The proof of the impact of President Trump’s tariffs will hinge critically on October’s data.

Source: Panjiva


