 En
EnCarriers continued to benefit from the import surge even as growth in October slowed down. Profits soared due to the combination of volume and increased rates, with Q3 2021 net income for the container shipping industry reaching $48.1 billion, according to a recent report by Blue Alpha Capital founder John McCown. This represents “a staggering $43.0 billion and nine-fold improvement from the $5.1 billion profit in the year-ago quarter,” McCown said. The jump in rates and profits is not without challenges, however, as the carriers negotiate contracts for 2022. Incorrectly gauging the “new normal” and how to capture it in contracts could leave either the shippers or carriers vulnerable to rapidly changing prices. This is a continuation of trends noted in Panjiva’s research of Sept. 21.
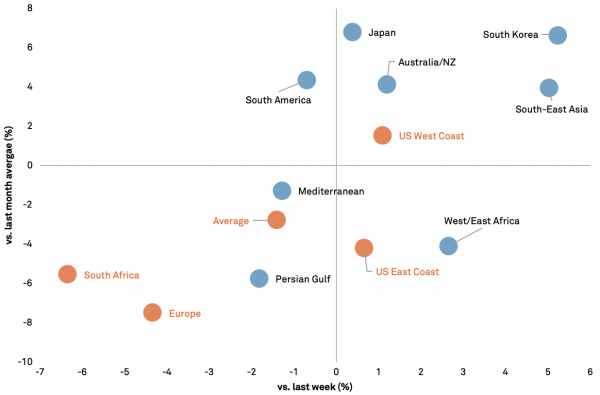
The average shipping rate out of China — collected from the Shanghai Shipping Exchange by Panjiva — shows a downturn in prices, slipping 1.4% in the last week and by 2.8% from the October average. Changes were not evenly distributed, however, with rates from China to South Africa and Europe seeing the largest declines, down 6.3% and 4.3% week over week respectively. Part of the drop may be related to uncertainty around the omicron variant of the coronavirus, which was first reported to the World Health Organization from South Africa on Nov. 24.
Shippers from China to the U.S. West Coast are getting no relief as rates continued to climb, rising 1.1% from the previous week to an aggregate increase of 225.7% since the end of 2019. Rates to the U.S. East Coast saw a decline of 4.2% from October but were up by 0.7% week to week. The persistence of rates shows the continuing impact of congestion, with containers continuing the pileup in yards due to a lack of inland capacity.
Source: Panjiva
Empty containers have been in focus recently as the lack of chassis and trucks to move them out of ports has led to capacity issues. This is the opposite of the situation earlier in the year when containers were stuck inland, facing the same capacity challenges, and represents a good example of the bullwhip effect in supply chains. The lack of containers to meet demand at ports triggered an import rush as boxes became available, reversing the problem. One of the ways that operators are starting to tackle the problem is through increased fees for late pickups, starting in Los Angeles and Long Beach, and now in Seattle.
Carriers that may be most affected are the ones that have imported a significant number of empty containers; they may be on the hook to move them out. Comparing imports of empty containers in October to last year, when such imports barely existed, generates exceptionally large numbers but reinforces the point that this is a relatively recent activity. Imports associated with CMA CGM increased by 922.2%, and containers imported by Hapag Lloyd increased by 3,662.5%. Maersk and MSC saw even greater gains, up by 23,083.0% and 121,361.1% respectively compared to very low imports in the previous year.
![]()
Source: Panjiva
The slump in overall imports in October extended to many carriers, with imports associated with Ocean and THE alliances falling by 4.1% and 12.1% year over year respectively. Yang Ming saw the largest fall, down 26.1% year over year in October, while the largest increase in those two alliances was CMA CGM, with volumes up by 1.1%.
2M continued to lead the alliances in volume growth, up 7.1% in total. This was driven by ZIM and MSC, which saw volumes increase by 27.1% and 13.6% year over year respectively. Maersk was the odd one out, falling 1.1% during the month, while unaffiliated Matson posted volumes that increased by 45.4% year over year.

Source: Panjiva


