 En
EnInbound container handling at U.S. mainland maritime ports climbed 8.1% on a year earlier in November, Panjiva data shows. That was the fastest rate of growth since April and means the year-to-date total of 24.6 million TEUs is 5.1% higher than the same period a year earlier. As outlined in Panjiva research of December 6 this growth has included a rotation in deliveries within Asia, and has been the result of a mixture of recovery in apparel and continued growth in both consumer and business electricals and electronics. It also likely means the eight month run in growth in total handling (including exports and empties) is likely to continue.

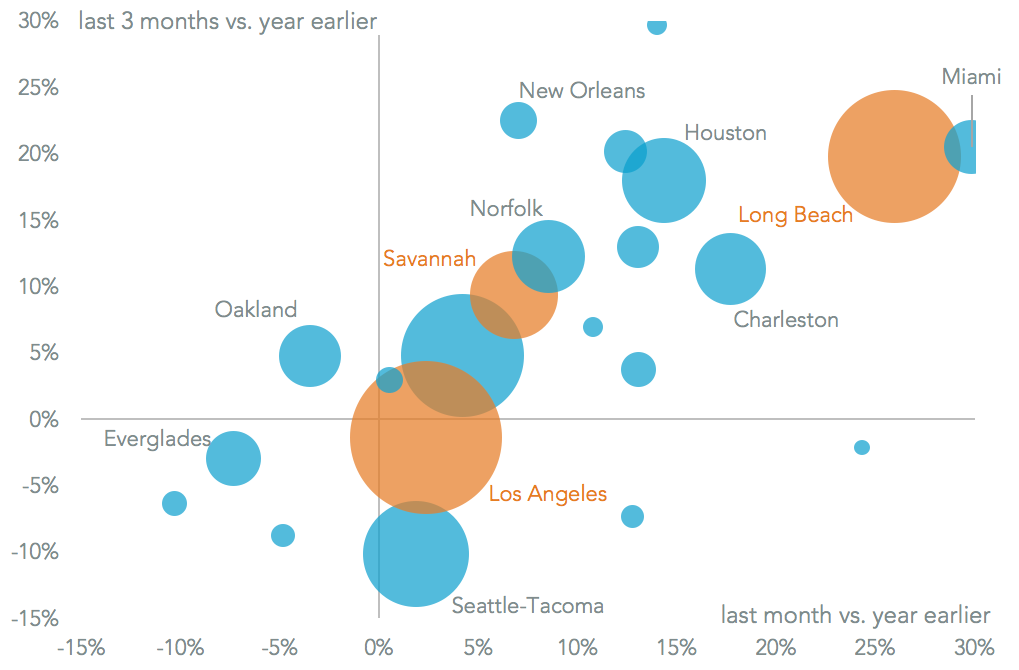
Source: Panjiva
The best performing of the major ports was Long Beach, which saw a 25.9% rise compared to a year earlier. That likely still reflects the unwinding of earlier losses sustained after Hanjin Shipping’s bankruptcy on August 31 2016. That may also explain the disappointing result from neighboring Los Angeles, which grew by just 2.3%. While the current wildfires aren’t projected to have a direct impact on the ports’ activities, the potential damage to the local economy may by reducing demand.
Notably Oakland saw a 3.5% drop in the month, possibly following the earlier fires. That may also reflect a weaker performance in the northwest more broadly, after Seattle and Tacoma expanded by just 1.9%. That did at least mark a turnaround from earlier declines, though it is still down 10.2% for the quarter after losing market share to Canadian ports.
Source: Panjiva
In the northeast there appears to be an ongoing shift in volumes to smaller ports, which is somewhat ironic given the efforts New York / Newark (which saw volumes rise just 4.2%) has made to attract larger vessels. Mid-sized ports in the region all outperformed including Baltimore (12.4% higher), Boston (up 12.8%), Philaport (which rose 13.0%) and Chester (14.0% better). There is a risk, however, of strike action coming after labor talks broke down due to disagreements on automation plans, Splash247 reported. With the current pay deal fixed through September 2018 there may not be problems in the short term though.

Source: Panjiva


