 En
EnThe ramifications of the trade war between China and the U.S. were front-of-mind for our readers in November. The most-read research focused on the $2.18 billion drag on U.S. exports to China suffered in September as a result of retaliatory tariffs. Corporate reactions in the form of exemption requests – with over 11,000 and counting – and pre-emptive strategies were a focus for the 3Q earnings reporting season. The potential for a new front in the U.S.-China trade war, based on labor practices, may be on hold for now though China is still cutting import tariffs more broadly. Finally, a parlous third quarter for the freight forwarders, including UPS, came despite surging volumes due to the trade war.
#1 The $2.18 Billion Cost of China’s Retaliation (Nov. 5): The U.S.-China trade war reached a crescendo in September with the imposition of duties on around $260 billion of bilateral trade at rates of 5% to 10% (referred to as list 3 products). That came on top of duties on $100 billion of trade in July (list 1) and August (list 2) at a 25% rate. The expansion of the U.S. trade deficit with China to a record $40.2 billion in September is a sign the trade war went against America that month. (Panjiva Research – Policy)

Source: Panjiva
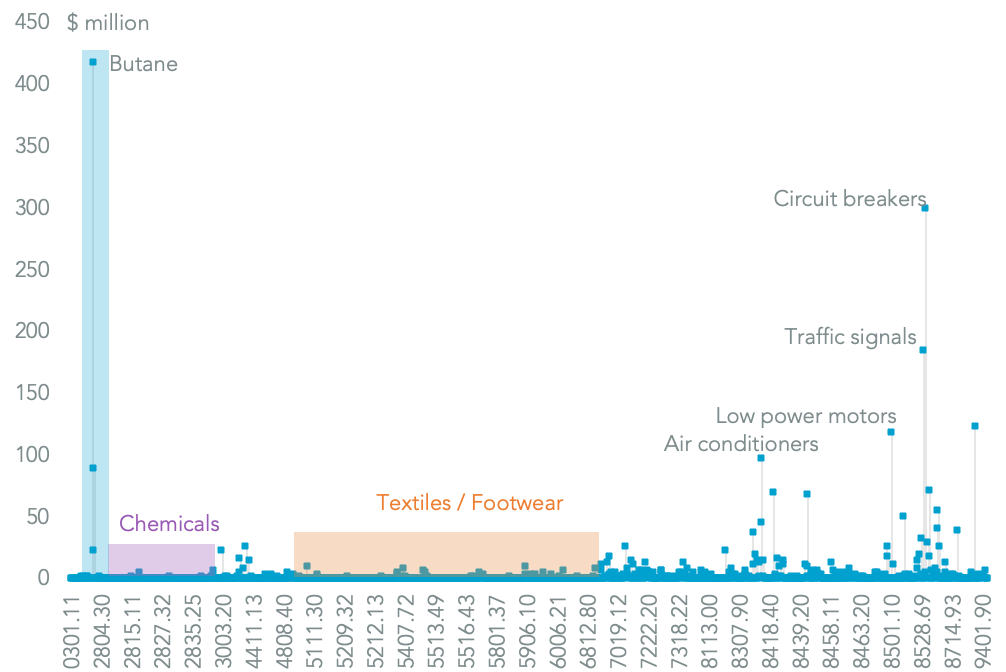
#2 Trump’s New Trade War Front (Nov. 10): The administration of President Donald Trump may launch an investigation of Chinese labor standards using the section 301 review process. The prior section 301 review of intellectual property rights kicked off additional duties of 10% to 25% on $250 billion of Chinese capital goods exports to the U.S. A labor-based review would likely sanction apparel, textiles, leather products and footwear. Most of those are so far are not subject to the additional duties. U.S. imports from China of the four groups were worth $61.62 billion in the 12 months to Sept. 30, with China representing 40.7% of total U.S. imports of those products. Leading products include luggage ($6.16 billion, already subject to 10% duties), sneakers ($4.69 billion) and sweaters ($4.61 billion). Companies including Ralph Lauren and Steve Madden have already indicated they will aggressively shift sourcing out of China. Other major importers from China include Target, Walmart, Samsonite and Skechers. (Panjiva Research – Apparel)

Source: Panjiva
#3 8,241 Cries for Help as Trump’s China Tariffs Bite (Nov. 2): The U.S. government has received 8,241 requests for exemptions from America’s section 301 duties on Chinese exports. The duties covered around $50 billion of products in two lists applied on July 6 and August 24. Exemptions have been received from 788 companies. None have had a formal approval yet while 9.9% of the requests have been denied. A large proportion of tariff-afflicted products are covered by the exemption requests. The requests cover products where imports in total (not just by requestors) reached $36.7 billion in the 12 months to Aug. 31. The largest products include speciality electronics ($1.9 billion) such as e-cigarettes, microprocessors such as those used in wearables ($1.7 billion) and passenger vehicles ($1.39 billion) including General Motors’. GM made 40 requests in total but is not waiting for approvals before updating its supply chains. The firm has cut its seaborne imports of the requested products from China by 37.0% in the third quarter of 2018 vs. the second quarter and has compensated with increased imports from Mexico. (Panjiva Research – Capital Goods)

Source: Panjiva
#4 Seven Supply Chain Strategies To Tackle Tariffs (Nov. 12): Tariffs have become a fact of life for many American companies. Panjiva’s analysis of 3Q conference calls from 369 firms from the S&P 500 indicates 142 discussed the impact of, and strategies for dealing with, U.S. tariffs on Chinese exports and imports of steel and aluminum. Of those, 102 had also discussed tariffs on their 2Q earnings call as well. A detailed review of 24 calls shows at least seven strategic responses. (1) Panasonic has accepted it may need to take a hit to profits in its contracts with Tesla while (2) FMC is seeking a government exemption from tariff in the first instance. (3) Cooper Tires’ price increases are being followed by its peers as it attempts to pass the tariffs, which are in effect a tax increase, on to its customers. (4) Price rises also have to cover increases in other costs, as Terex has found, requiring significant cost cutting plans in order to maintain group-wide profitability. (5) That cost cutting can include switching suppliers to those outside of China as Timken has already started doing, increasing imports from India as a replacement. (6) A more extreme example, particularly for firms with long supply chains such as BMW, is to localize assembly. (7) Others, such as Steve Madden, are not waiting for tariffs to be imposed on their products and are already diversifying their sourcing. (Panjiva Research – Capital Goods)

Source: Panjiva
#5 Black Friday Shoppers Get Pre-Tariff Bargains (Nov. 20): Strong consumer confidence and concerns about a widening of the Trump administration’s tariffs on Chinese exports have led to a surge in U.S. imports of consumer electronics and home appliances ahead of the holiday shopping season. Seaborne imports of laptop computers surged 46.4% on a year earlier for the four months running to Oct. 31 – the main shipping season for holiday sales products. Meanwhile imports of TVs climbed 36.6% and audio systems increased 30.2% over the same period. A similar effect can be seen for household appliances with fridges rising 56.9% and microwaves by 20.0%. By contrast a decline in washing machines was due to tariffs applied in early 2017. With 51.4% of U.S. home appliance imports coming from China it’s likely there was stockpiling ahead of a potential new round of tariffs in the new year. Exporters from China that have accelerated shipments include Dometic’s 85.1% surge and Midea’s 16.1% rise, while LG Electronics and Samsung Electronics both dropped as a result of the aforementioned washing machine tariffs. (Panjiva Research – Retailing)

Source: Panjiva
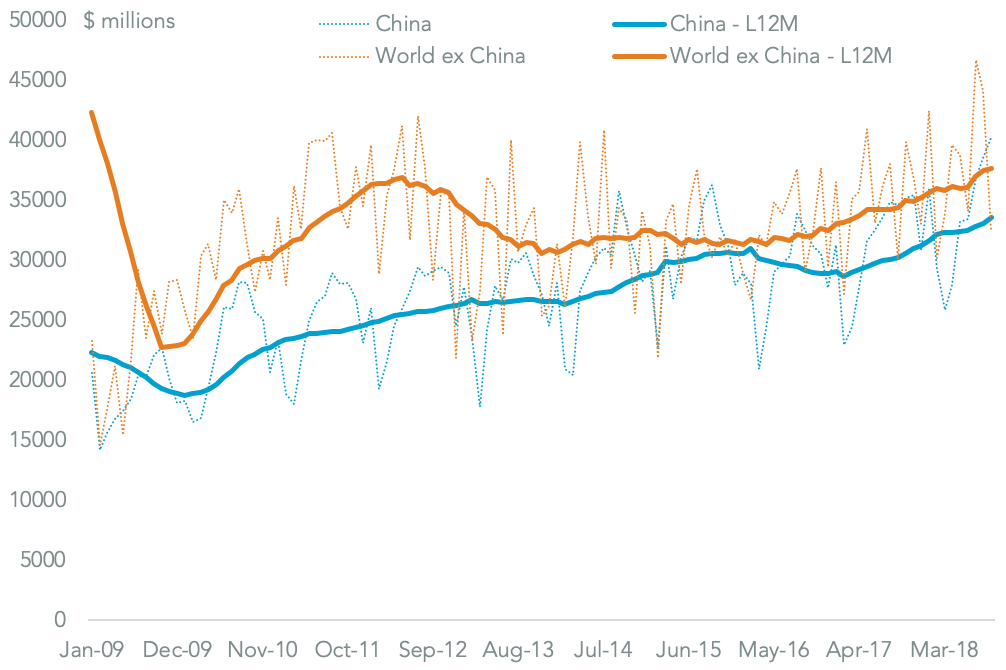
#6 Xi’s Tariff Cuts Hasten The Trade Singularity (Nov. 5): President Xi Jinping has launched the China International Import Expo with a commitment to increase China’s imports in order to “increase resident’s income and consumption capacity” including tariff reductions. That’s effectively a reflationary tax policy. Chinese imports in the 12 months to Sept. 30 reached $2.13 trillion after rising 7.1% annually in the past three years. By comparison the U.S. imported $2.50 trillion over the same period after a 3.0% increase. At current rates of growth China could be a bigger “customer” than America, the so-called “trade singularity”, within five years. The trade war with the U.S., which represented 19.1% of China’s imports year-to-date, may hinder President Xi’s ambitions though there is significant room to reduce import tariffs. Indeed, the government has already cut duties on $130.35 billion of capital goods from Nov. 1 after reducing duties on $64.23 billion of consumer goods in June. (Panjiva Research – Policy)
Source: Panjiva
#7 Pressure Ahead for the $73 Billion Drug Import Industry (Oct. 29): President Trump has proposed a new healthcare policy which would base U.S. drug prices on levels seen in other countries. The growing demand for healthcare services and demand for lower cost products has led to a $73.4 billion import industry for pharmaceuticals in the 12 months to Aug. 31. That was 7.5% larger than a year earlier and included a 33.6% surge in volumes offset by 19.8% deflation in average import values per gram (AIVG). Not all drugs have seen deflation though, with imports of oncology treatments seeing a 16.6% rise in volumes despite 17.8% AIVG inflation. Anticonvulsants (AC) meanwhile have seen a 25.0% jump in volumes despite price deflation of just 2.0%. Leading shippers of ACs to the U.S. include Aurobindo (24.9% of volumes shipped by sea in the 12 months to Sept. 30) and Alkem (13.4%). (Panjiva Research – Healthcare)

Source: Panjiva
#8 China “Winning” The Trade War (Nov. 2): The U.S. trade deficit surged 21.6% higher in September to $54.02 billion, the 19th month of expansion since January 2017. Growth in the goods deficit to its highest since July 2008 was the main driver, though slowing growth in services exports – including a decline in insurance – didn’t help. Unsurprisingly trade with China was the main driver of the goods deficit with tariffs on $260 billion of bilateral trade being applied from Sept. 26. China’s retaliatory duties appear to be having a bigger effect with U.S. exports having fallen by 10.3% year over year. America’s imports from China meanwhile jumped 10.1% as buyers likely took a late opportunity to build inventories. The widening of the deficit with China to a record $40.2 billion will overshadow the forthcoming summit meeting between President Trump and President Xi. (Panjiva Research – Policy)
Source: Panjiva
#9 UPS Margins Head Down on Fuel (Oct. 24): UPS reported third quarter revenue growth of 9.2%, helped by a 16.6% rise in forwarding revenues and 11.4% in supply chain freight handling. Yet, “unforeseen currency and fuel headwinds” meant that profitability was lower than expected. Indeed, UPS’ EBITDA margin of 13.5% was below the 14.3% expected by analysts and was also the lowest since at least 2013. The impact of rising fuel costs can be seen in the 5.7% rise in traded bunker fuel costs in the third quarter sequentially as well as the 7.5% rise in container shipping rates charged by the shipping lines. International volume growth may be increasingly challenged in the fourth quarter by the bilateral duties on $360 billion of trade between the U.S. and China. UPS’s total U.S.-inbound, seaborne freight handling fell 9.5% in the third quarter year over year and will face significant challenges in the fourth quarter given 60.9% of those volumes came from China. (Panjiva Research – Logistics)

Source: Panjiva
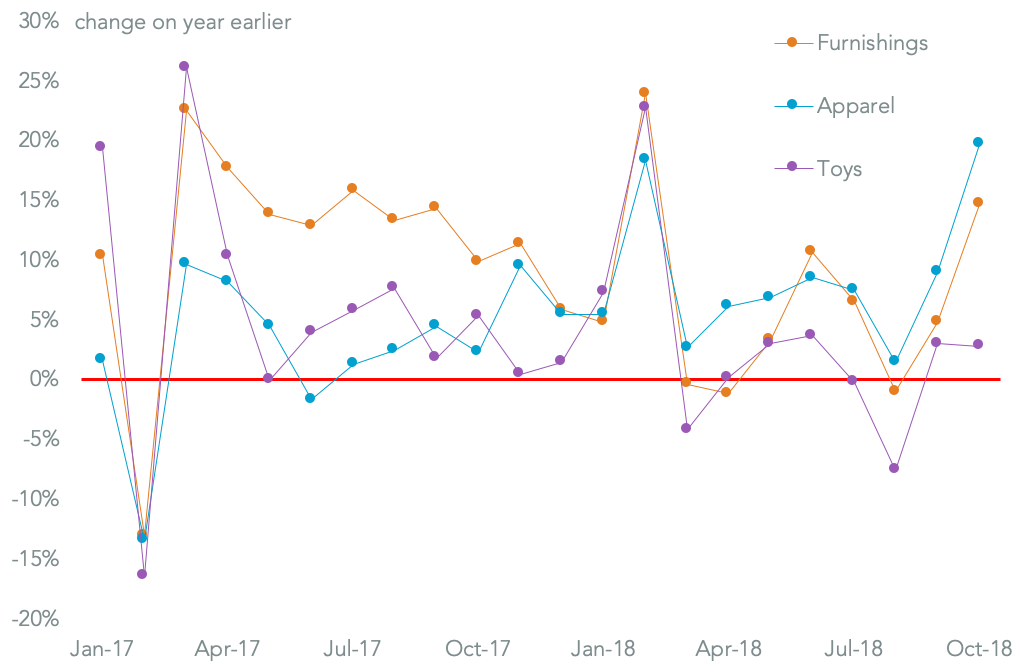
#10 Tariffs Fail To Dent Demand as America Buys Foreign (Nov. 12): The strength of the American economy offset the impact of tariffs in October, with U.S. seaborne imports having surged 11.9% higher on a year earlier. That was the fastest rate of growth since March 2014 and was the result of a 16.1% surge in imports from China despite the imposition of 10% tariffs on $200 billion of products in late September. Economic growth was a major mitigating factor and can be seen in a 27.1% jump in imports from Vietnam and 25.8% from South Korea. Consumer products were the main driver of growth with imports of furniture up 14.7% and apparel by 19.7%. Industrial import demand also remained strong with capital goods rising 8.1% and steel and aluminum having climbed 10.8% despite wide-ranging duties applied earlier in the year. The prospect of higher duties on Chinese imports from January and consumer sentiment at an 18-year high will do little to temper import demand in the rest of the year. Full year import growth of 5.7% looks achievable. (Panjiva Research – Retailing)
Source: Panjiva


