 En
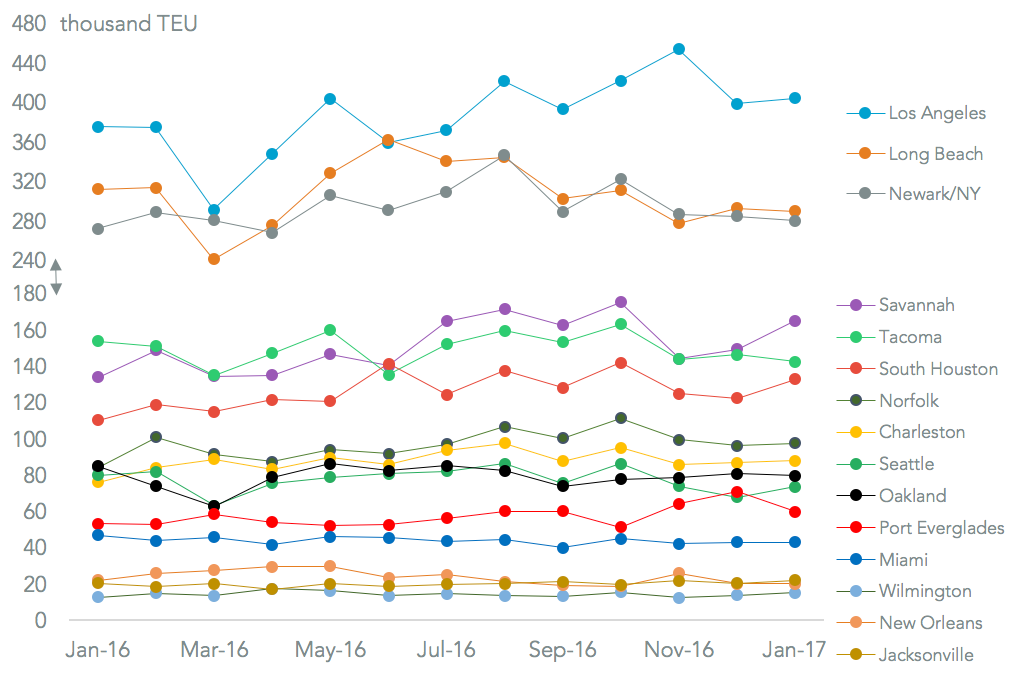
EnU.S. imports increased 5.4% in shipment terms in January as the result of higher shipments from Europe and China, as discussed in Panjiva research of February 7. This required U.S. ports to handle 2.11 million TEUs of containerized freight, Panjiva data shows. Regionally there was a general continuation of the trends seen in late 2016 – namely the east coast ports outperformed those on the west coast, and northeast ports did better than those in Florida.

Source: Panjiva
Among the key ports Los Angeles outpaced Long Beach for the seventh straight month, with volumes imported climbing 7.7% vs. a 7.1% contraction for Long Beach. Yet, the complex only handled 2.2% more traffic overall. The future of Hanjin Shipping’s assets in Long Beach port is now resolved, so a recovery may be possible if MSC and Hyundai MM allocate more volumes to it. The ports of Seattle and Tacoma also dropped, but 7.5% jointly – the Hanjin Shipping effect there (it owned assets in Seattle) is likely minimal as both ports contracted by a similar amount.
The biggest winners in absolute terms and in percentage terms were Savannah (which solidified its number three position) and Houston (number six but close to Tacoma).
Source: Panjiva
Import volumes handled in the port of Savannah increased 23.4%, the fastest rate yet and the seventh straight double-digit increase. The continued growth has led the port to invest in expansion to its rail and storage capabilities. This growth was broad-based, with the port benefitting from a 35.5% jump in imports of goods from Europe.
That was possibly driven by a rush of auto-part imports to beat any planned tariffs or border-adjustable taxes. Similar might be said for the 37.9% rise in shipments from China, though U.S.-wide imports only increased 5.7%. That would suggest the port has benefited from increased volumes travelling via the Panama Canal.

Source: Panjiva
A similar trend of tariff-anticipation may be at work in Houston. Growth there was 20.5%, led by a 54.8% jump in shipments from China and Hong Kong and a 39.4% uplift in shipments from Mexico. It actually lost out in terms of European volumes, these fell 5.0% on a year earlier.

Source: Panjiva


