 En
EnInbound container handling at U.S. ports increased for a fourth straight month in June, Panjiva data shows, with a 4.0% rise compared to a year earlier. That did mark the slowest rate of expansion – aside from February’s lunar new year holiday driven effect – since September. The figure may be understated given Maersk’s filings may have been delayed due to the Petya computer virus, as outlined in Panjiva research of June 28.
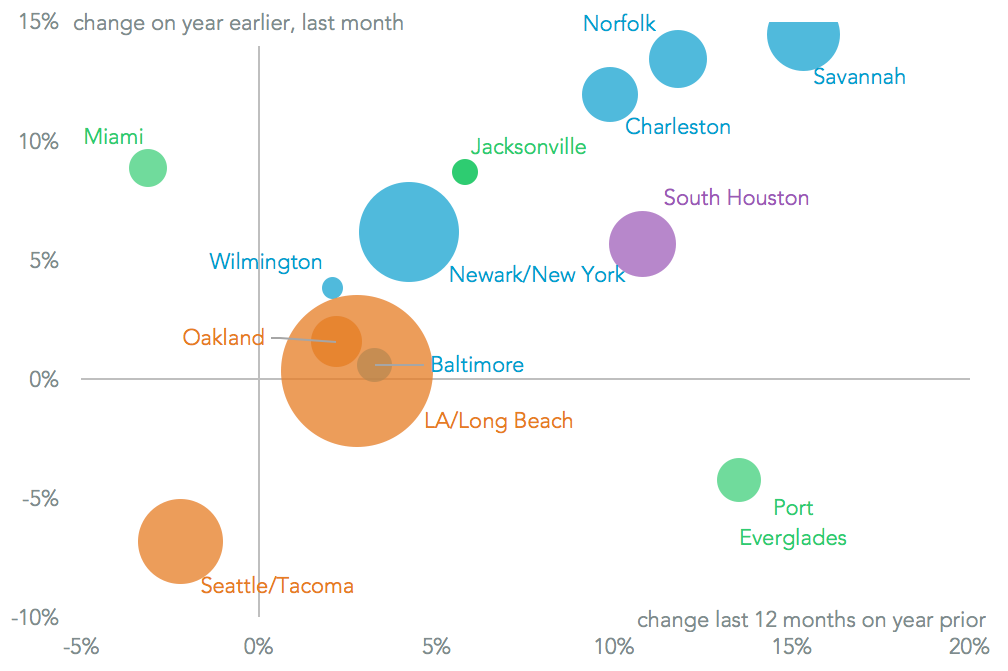
Broadly speaking the southeastern ports of Savannah (14.5% higher than a year earlier) and Charleston (11.9% better) outperformed the group. That may in part reflect renewed wins of market share of traffic from Asia via the Panama Canal. Shipments from Europe were among the fastest growing regions in the month, with a 12.8% increase, which also favors east coast ports over those in the west.
Source: Panjiva
The weaker performance of the west coast ports is shown by the 0.4% increase in LA/Long Beach and 1.6% rise in Oakland. Both LA and Long Beach remain well ahead of Newark/New York. The latter grew 6.2% in June, and will likely see an acceleration in growth in July. That follows the completion of the Bayonne Bridge raising project.
The worst performing region continues to be Puget Sound, where Seattle/Tacoma fell 6.8%, bringing the 12 month total decline to 2.8%. A recovery may take some time to come through, with construction on the Pier 4 extension at South Harbor not due until to be completed until spring 2018. Also notable was a 4.2% decline at Port Everglades, the first decline since October and potentially reflecting a slowdown in activity at Latin American suppliers.

Source: Panjiva


