 En
EnThe post-lockdown consumer recovery in the U.S. stalled in November, with total retail sales growth of just 2.5% year over year compared to a 5.8% increase in October and 7.9% in September, Panjiva’s analysis of official data shows. That included a slide in automotive sales, as outlined in Panjiva’s research of Dec. 16, though underlying non-auto sales only rose by 4.5% compared to 6.7% a month earlier.
The rotation in favor of online shopping can be seen in the 30.0% rise in non store sales compared to a 19.9% slide in department stores, 9.9% drop in electrical stores and growth of just 0.4% in furniture stores.

Source: Panjiva
Traditional retailers have benefited in part from the shift to online sales, as noted in recent earnings calls held by Gamestop and Guess? in the electricals and apparel sectors respectively. However, the ongoing surge in consumer goods imports raises the risk of oversupplies and expanded inventories after the holiday season. That comes as the U.S. port system, particularly on the west coast, remains congested making late deliveries more likely.
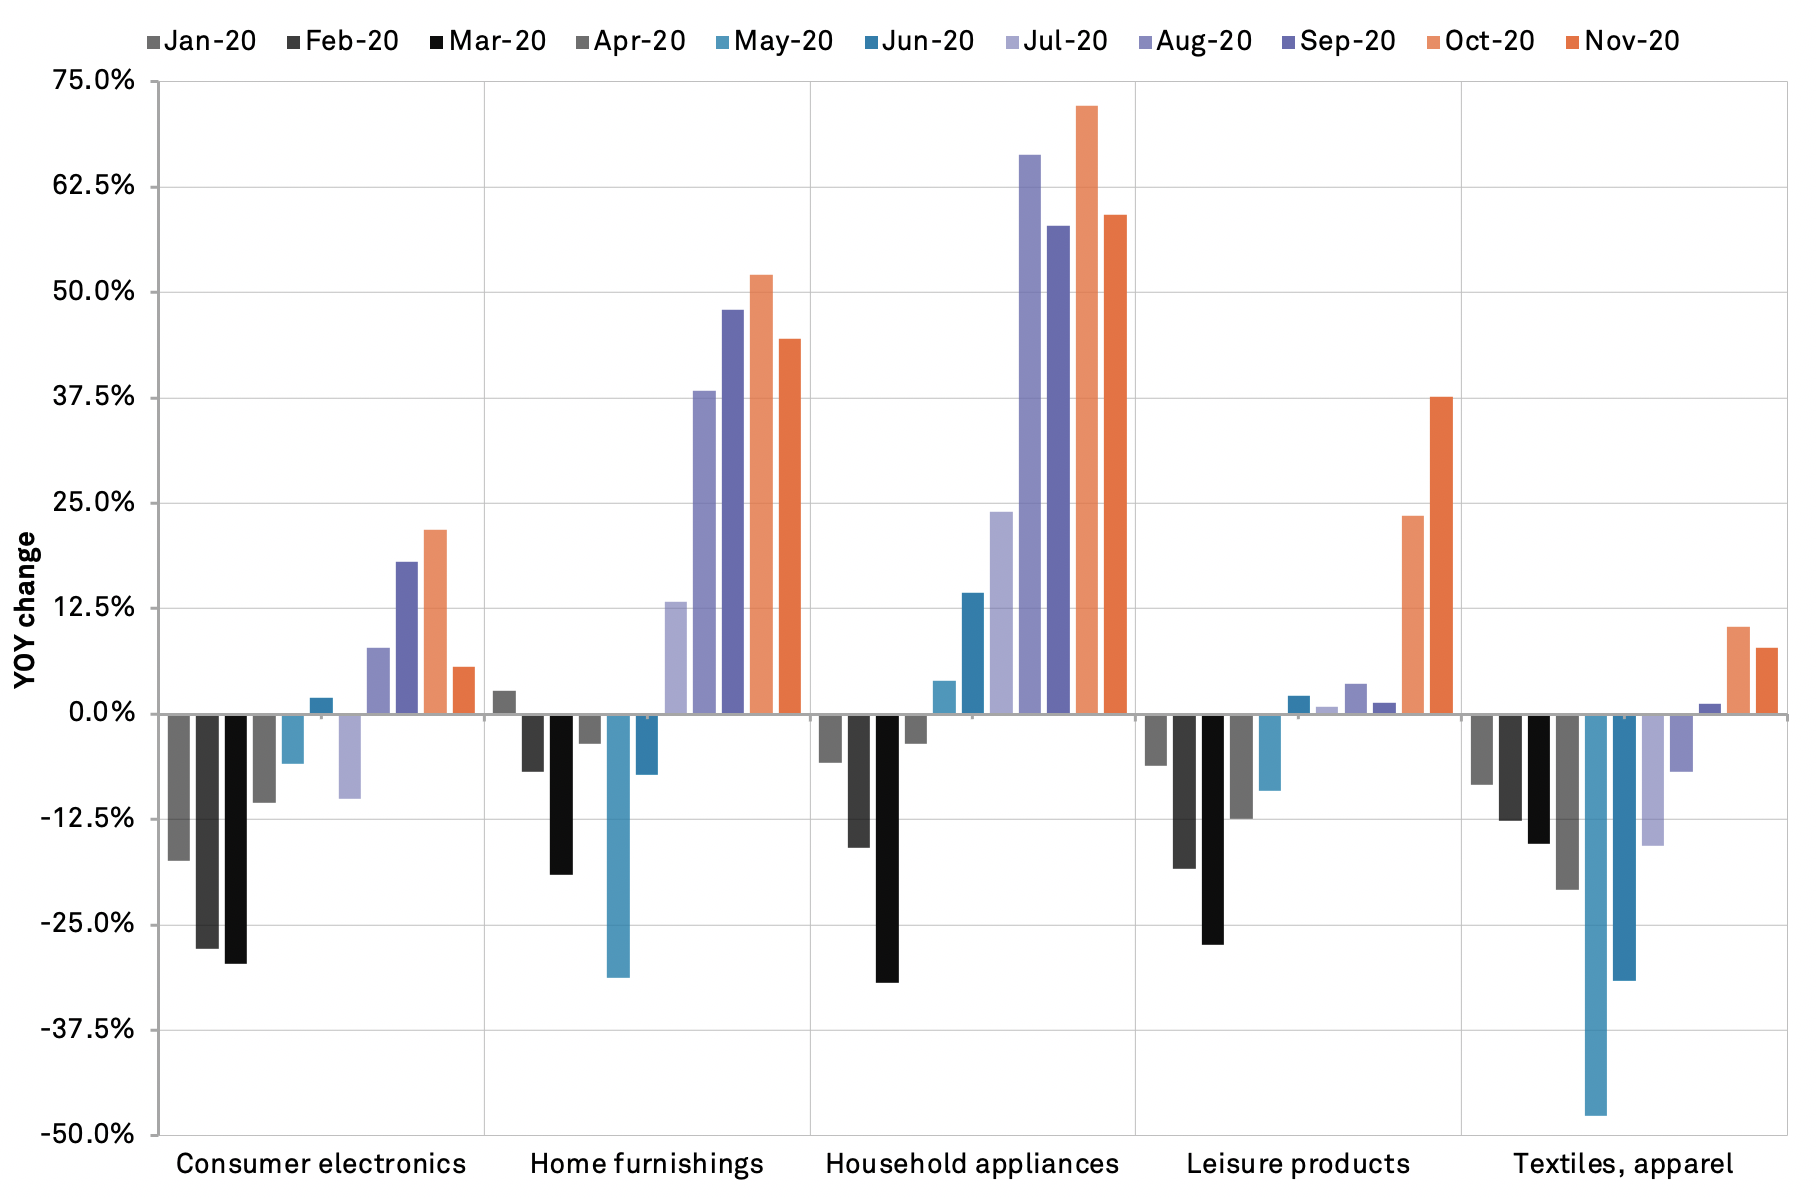
Panjiva’s data shows that imports of consumer discretionary products surged 30.0% higher year over year, only slightly slower than the 31.8% rate seen in October. The rate of expansion slowed in five of the six sectors tracked by Panjiva, the exception being leisure goods where there has been a late recovery in imports of toys just ahead of the gift buying season. The growth rate of 37.6% year over year in leisure products compared to 23.6% a month earlier.
The fastest rate of growth has continued to be seen in household appliances and furniture which rose by 59.2% and 44.5% respectively. Year-to-date imports of the two sectors are well above a year earlier, by 21.9% for appliances and 12.0% for furniture, indicating the strength of demand in response to stay-at-home needs resulting from the pandemic.
By contrast to appliances, the consumer electronics segment by contrast slowed to growth of 5.7% in November from 21.8% in October and is still down by 3.4% year-to-date. Similarly, apparel rose by just 7.8% in November and is down by 21.3% year to date.
Source: Panjiva
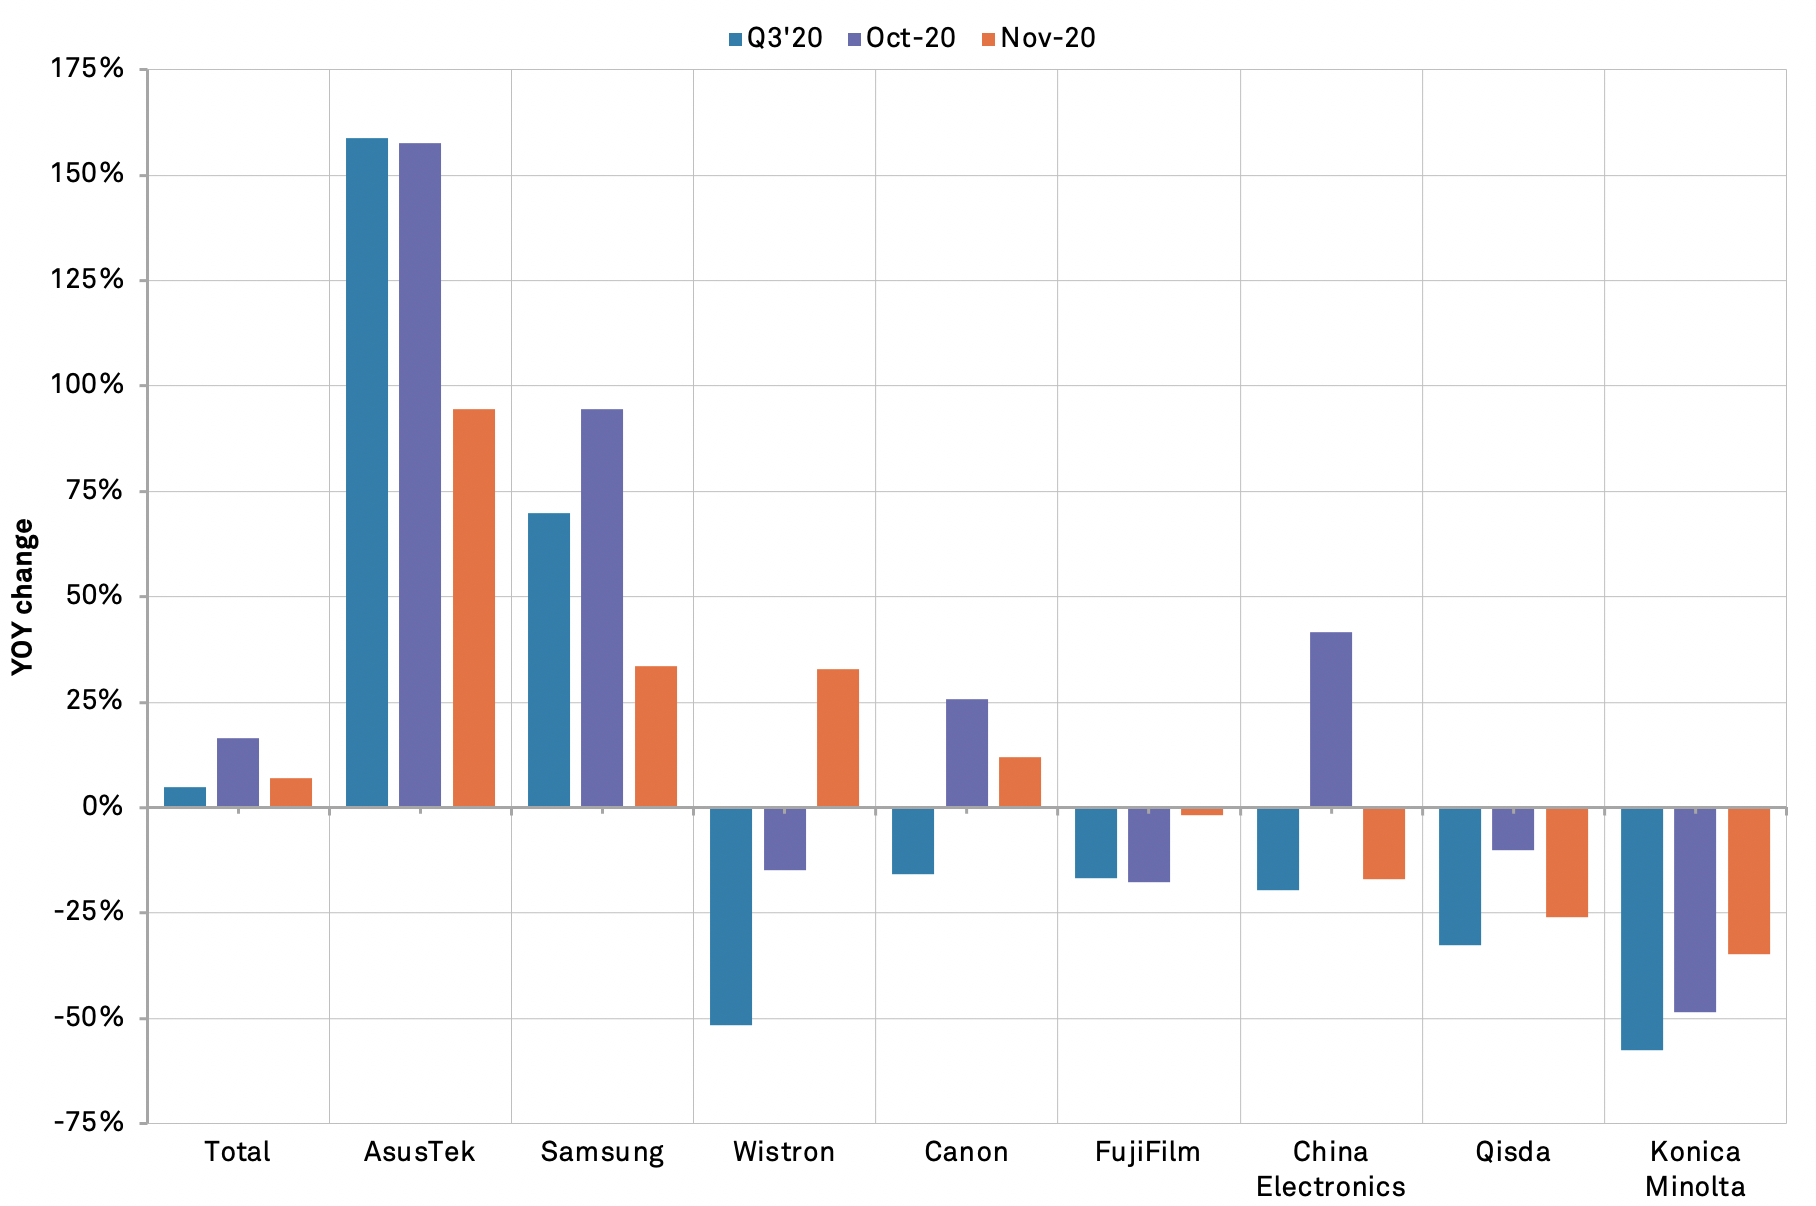
The slowdown in shipments of consumer electronics was spread across most major manufacturers. Importers of laptop computers still continued to expand rapidly including imports linked to AsusTek and Wistron which increased by 94.4% and 32.7% respectively. Demand for computers is also being driven by work- and school-from home demand still.
Importers focused on televisions and audio equipment saw a more marked slowdown with shipments linked to Samsung Electronics having slowed to a 33.5% increase while TPV, owned by China Electronics, actually declined by 17.0% after expanding a month earlier.
Peripheral makers meanwhile, including products ranging from cameras to printers, saw a decline in some instances including a 1.9% drop in FujiFilm’s shipments and a 34.7% slide for KonicaMinolta.
Source: Panjiva


