 En
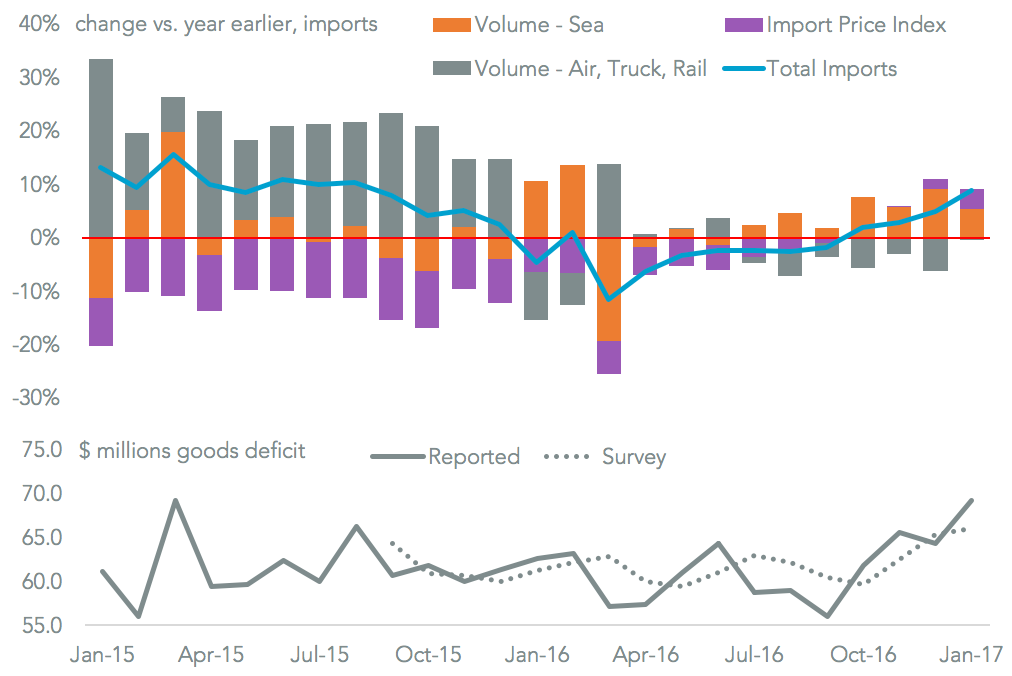
EnThe U.S. advance trade in goods deficit was $69.2 billion in January, according to official figures, the highest since March 2015. It was also wider than the $66.0 billion expected by economists, according to Bloomberg (paywall). As previewed in Panjiva research of February 24 this includes an expansion of both imports, by 8.9%, and exports which were 8.3% higher than a year earlier. Both were led by an expansion of seaborne shipments.
Source: Panjiva
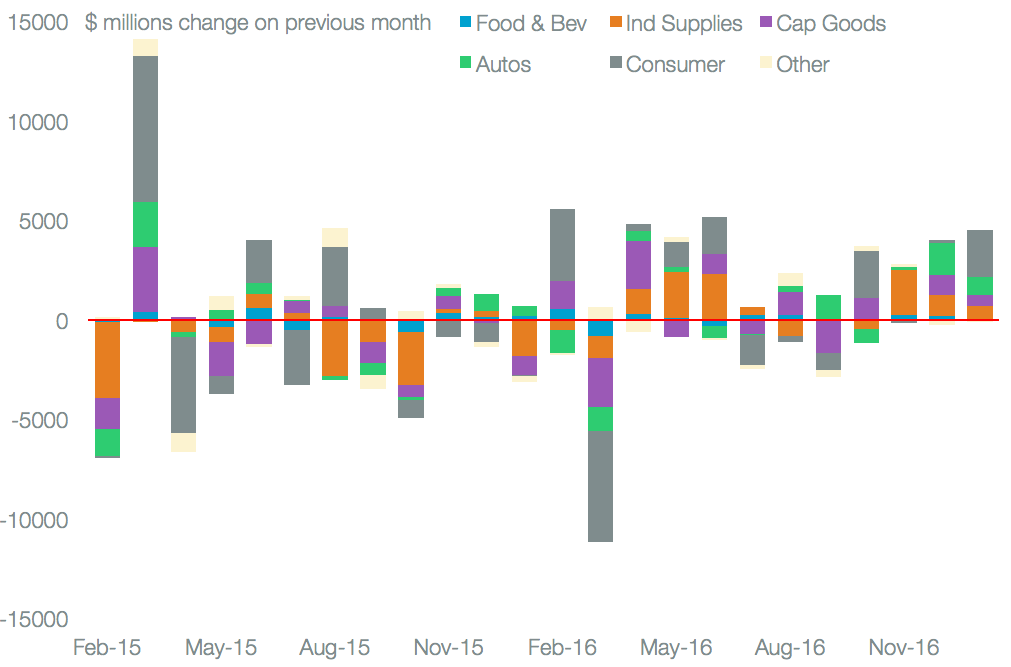
While the expansion in imports on a year earlier was likely the result of higher-than-expected oil prices, which has also impacted Mexico, it was a short term rise in consumer goods imports that may have led to the surprisingly high deficit. These expanded by $2.38 billion, or 4.8% compared to the prior month, including an expansion in toys. All the major categories expanded, however, adding some credence to the concept that imports were accelerated ahead of the risk of new taxes or tariffs.
Source: Panjiva
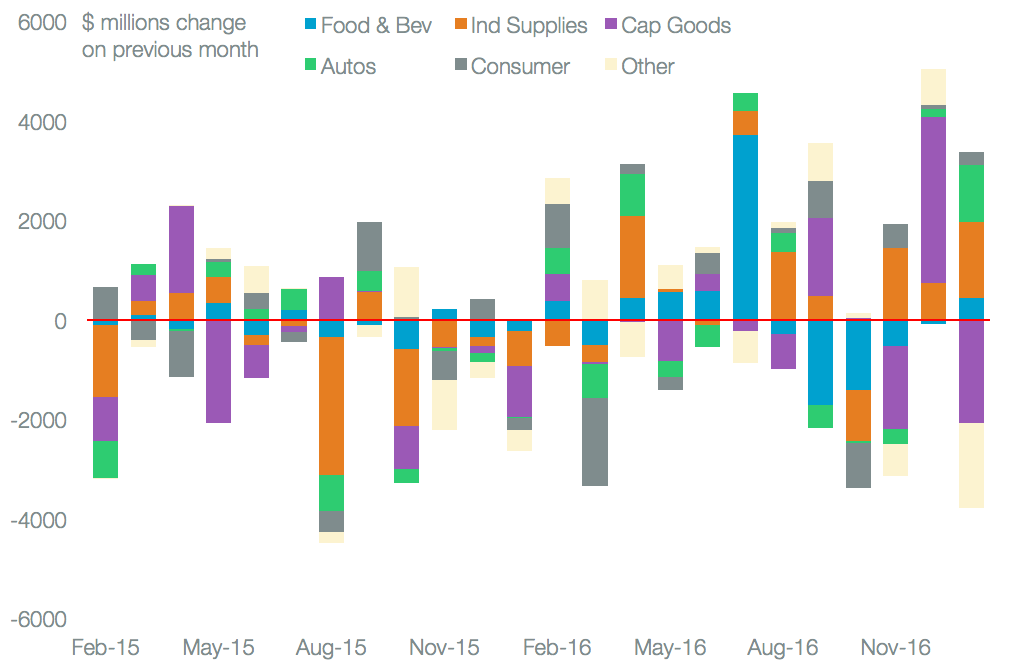
The expansion in exports was partly driven by increased oil products sent to Mexico compared to a month earlier. These may reverse once the country’s production problems are sorted out. The auto sector also expanded with a 9.3% expansion outstripping the 2.9% rise in imports. That may swap around in February given the U.S. exports parts and imports completed vehicles. The full deficit, due on March 7, will likely be the one that gets more political attention than the advance release, while future figures may also include a redefinition of re-exports.
Source: Panjiva


