 En
EnThe Ports of Los Angeles and Long Beach experienced an 11.9% contraction in container handling in February compared to a year earlier. Long Beach outperformed Los Angeles for the first time since June 2016, suggesting the problems that had beset it in the wake of the Hanjin Shipping bankruptcy may be behind it. While Long Beach’s volumes fell 11.2%, those for Los Angeles dropped 12.4%. Within Los Angeles’ drop was a 19.8% drop in import volumes, making it the worst performing large port in the nation, as discussed in Panjiva research of March 8. One area where it did better than Long Beach was in exports, which increased 6.1% vs. a 2.6% fall for Long Beach.
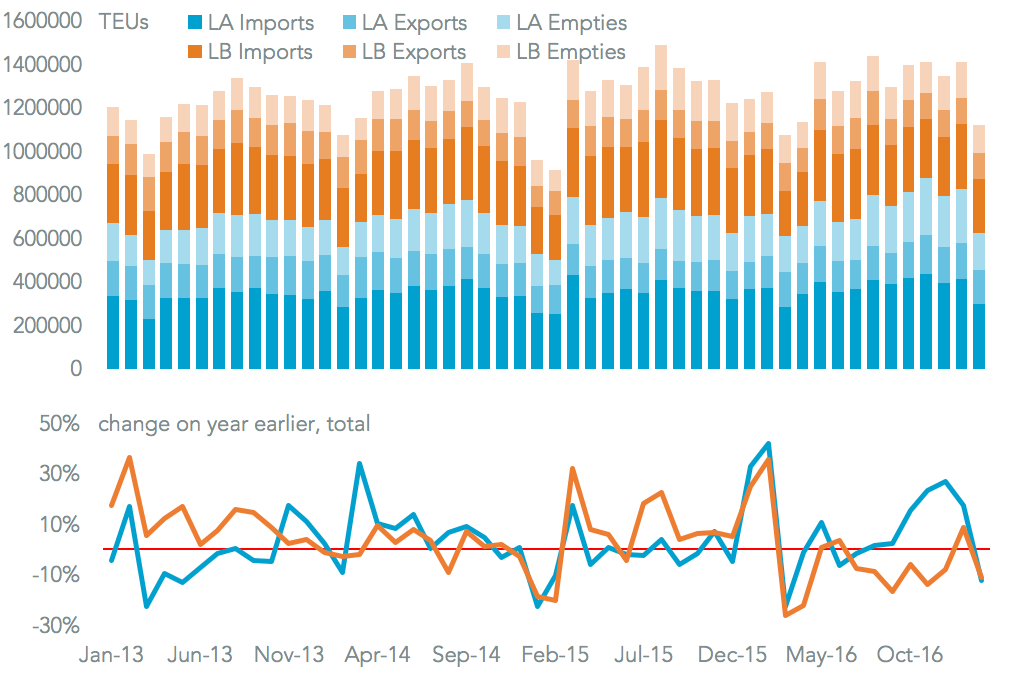
Source: Panjiva
The problem was not isolated in southern California. The Port of Oakland’s container handling fell 7.0% on a year earlier in February. That also included with imports falling significantly – by 9.2% – offset by a better export performance, though they were still 1.2% down. In aggregate the three ports’ imports fell 17.1%, while exports inched ahead 1.4% bringing total traffic to an 11.3% drop on a year earlier.
All three ports are heavily exposed to freight from China and Hong Kong, with 57.6% of traffic in the past year to February 28 coming from there, Panjiva data shows. The drop is likely due to a slow-down in manufacturers, and buyers, trying to get ahead of new taxes and tariffs as Chinese port activity actually increased in the month.
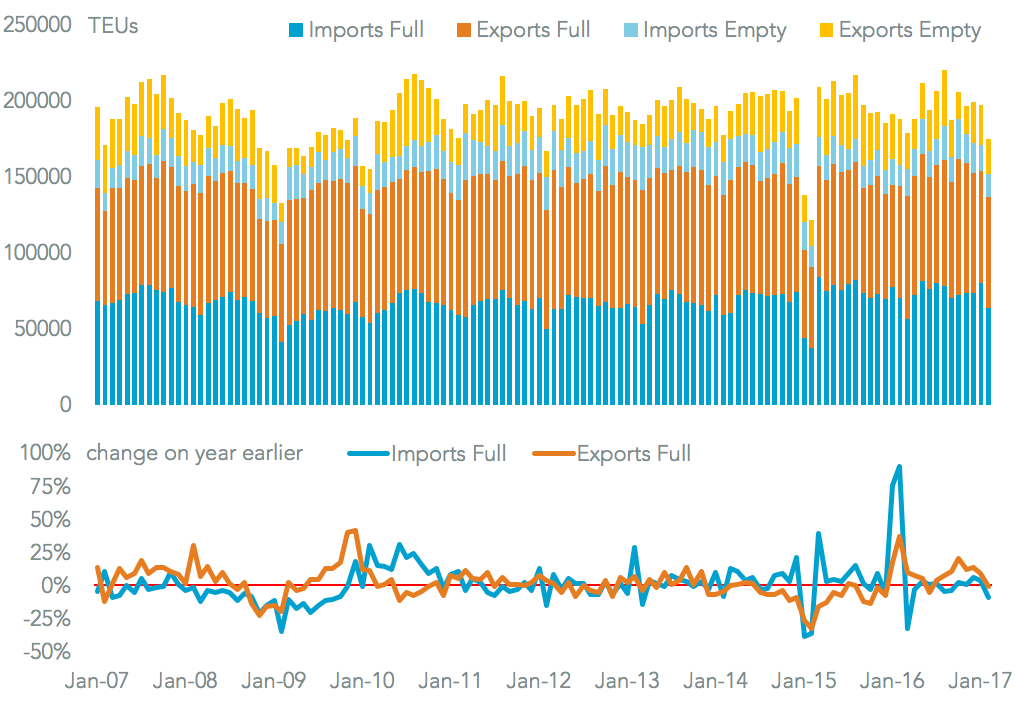
Source: Panjiva


