 En
EnU.S. seaborne, incoming container handling dropped 7.1% on a year earlier in February, preliminary Panjiva data shows. That likely reflects a mixture of the timing effects from the lunar new year on Asian shipments, as well as a reduced urge among importers to beat new taxes or tariffs, as discussed in Panjiva research of March 7.
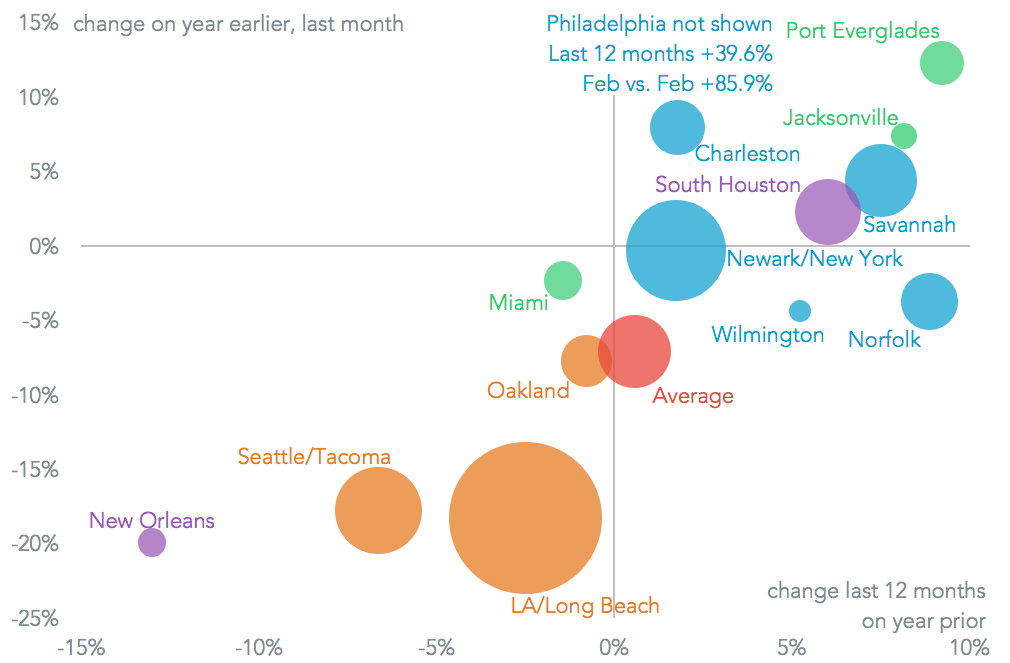
The most rapid slowdown, consistent with reduced Asia traffic, came from the west coast ports including a 19.9% drop in shipments into Los Angeles and 16.3% into Long Beach. That was Los Angeles’ first year-over-year fall since June, and the first time since March that Long Beach did better (or less worse) than LA. Southeast coast ports, including Savannah and Charleston, and Florida ports (except Miami) outperformed the northeast ports for the month. That would suggest the effect of the Panama Canal extension is still in force.
Source: Panjiva
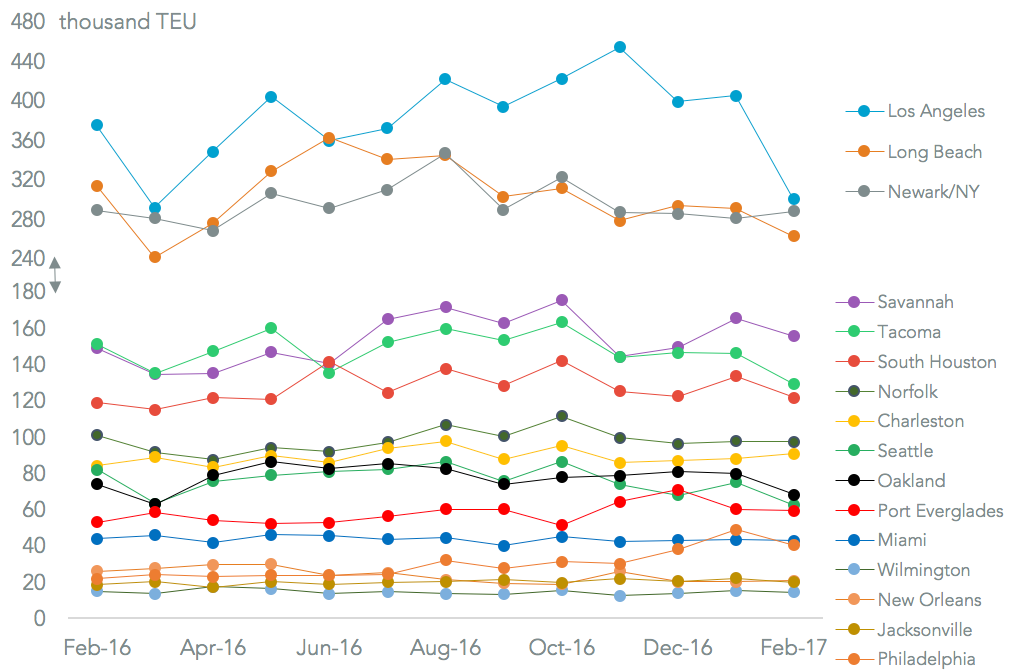
The Port of New York saw traffic inch down by 0.3% on a year earlier, but that was sufficient for it to overtake Long Beach as the second largest port for the month. New York should see more significant growth longer term as APM Terminals executes on its investment plan.
Savannah extended its lead over Tacoma as the fourth largest individual port, and may go further given the proactive approach being taken by port management to continue dredging operations.
Seattle managed to maintain its 10th place ahead of Port Everglades, but after four straight months of declines it fell to its lowest level of handling since at least 2007. Philadelphia’s tear continued, with its 85.9% jump in handling on a year earlier not quite sufficient to assure 11th ahead of Miami.
Source: Panjiva
Panjiva’s analysis of over 500 port-to-port pairs shows Yantian-to-Los Angeles was the top combination, followed by Shanghai-to-Long Beach. Tacoma’s exposure to mid- and small-scale Canadian ports (the fourth ranked combination) explains the region’s poor performance – outside energy Canada’s exports have been falling. Newark/New York’s relative high exposure to Asia explains its modest slowdown, while Houston’s exposure to booming Mexico helped its steady expansion.
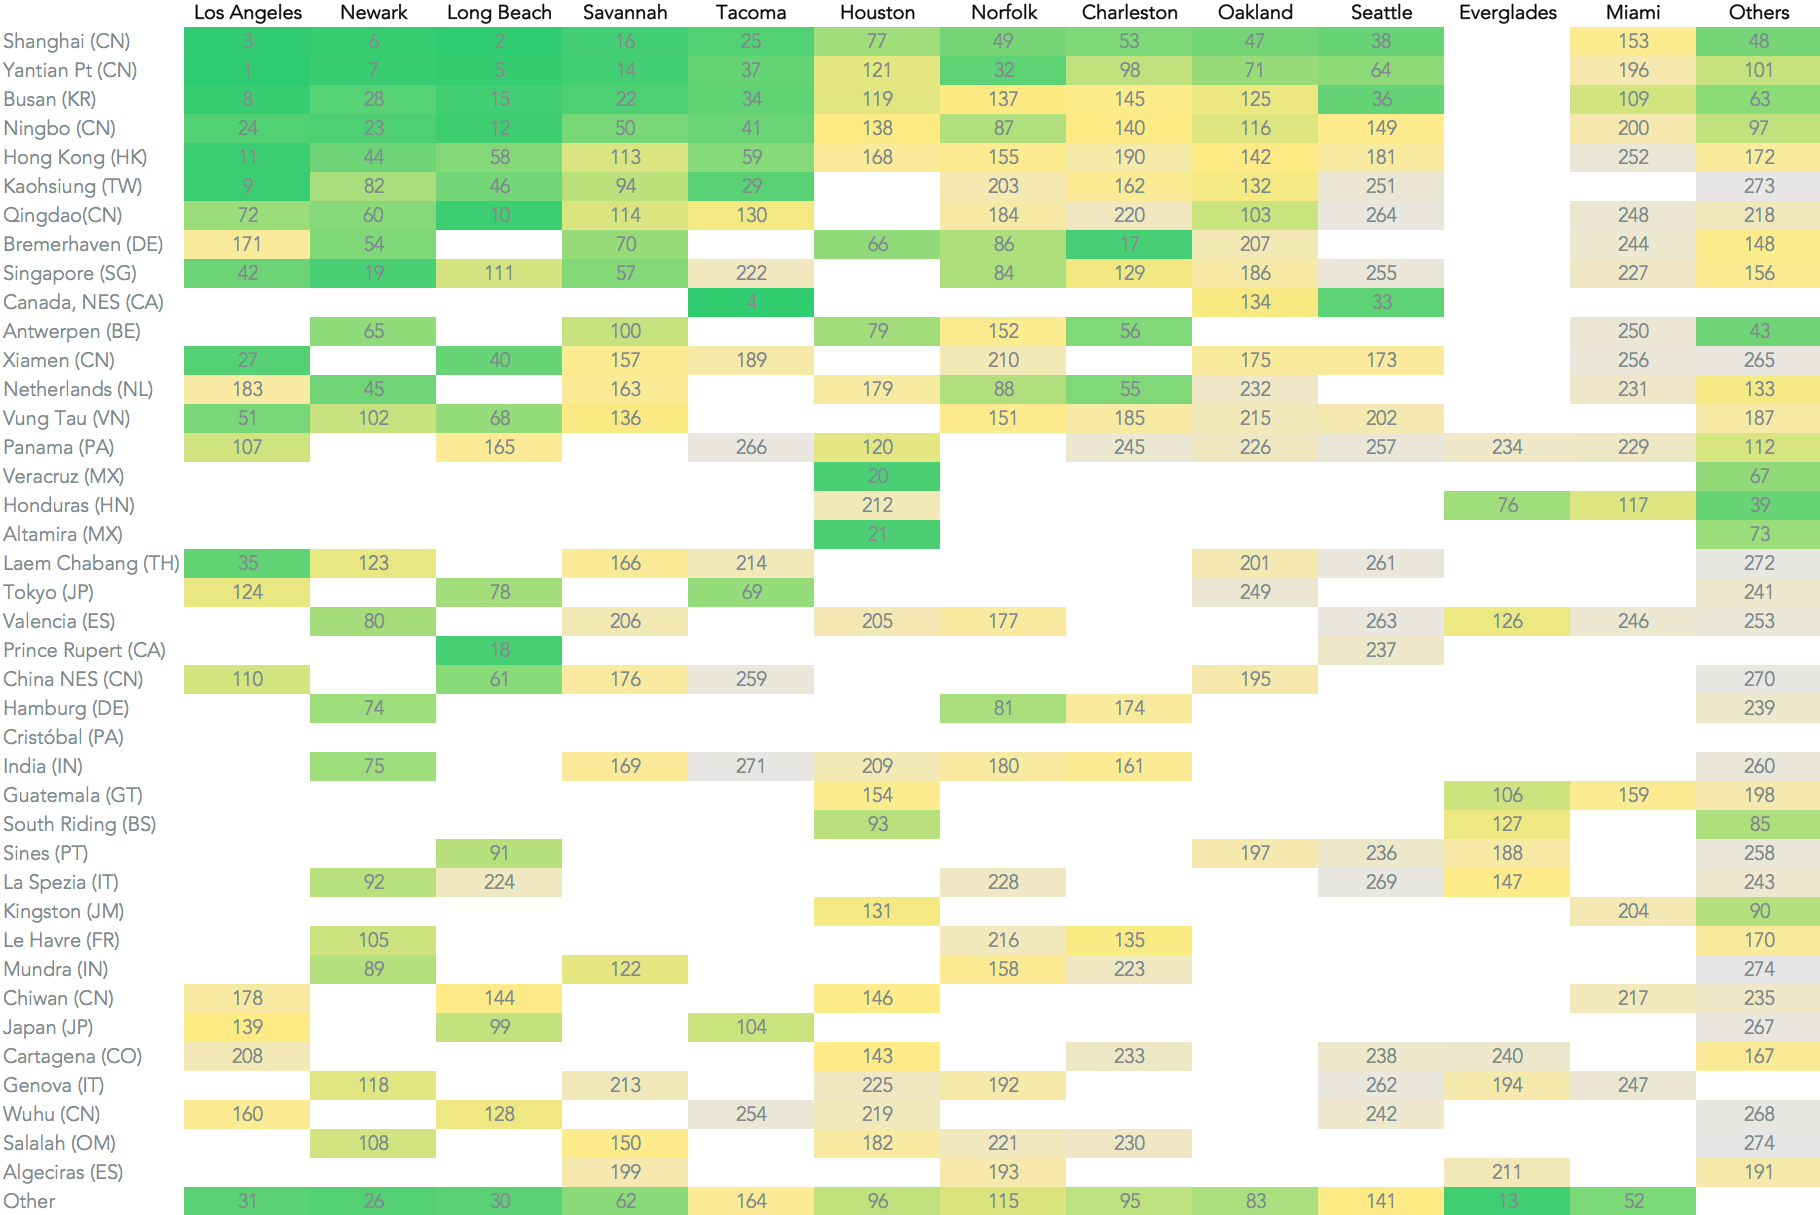
Source: Panjiva


