En
EnU.S. seaborne imports fell 8.0% on a year earlier in February, Panjiva data shows on a preliminary basis. That’s the first drop since June and is the first monthly read wholly under the Trump administration. This follows a 9.2% jump in the value of goods imports in January, as discussed in Panjiva research of March 7.
This may partly reflect slow shipments early in the month due to the lunar new year, though trade data from South Korea discussed suggests this may be minimal. An alternative explanation is that the prior bump likely reflected importers’ desire to get ahead of any new taxes or tariffs. Now that these appear to be taking longer to implement than initial rhetoric suggested we may be seeing a return to normal. The risk case to this is flagged by the recent ISM manager survey, which is not as downbeat as this data would initially suggest.

Source: Panjiva
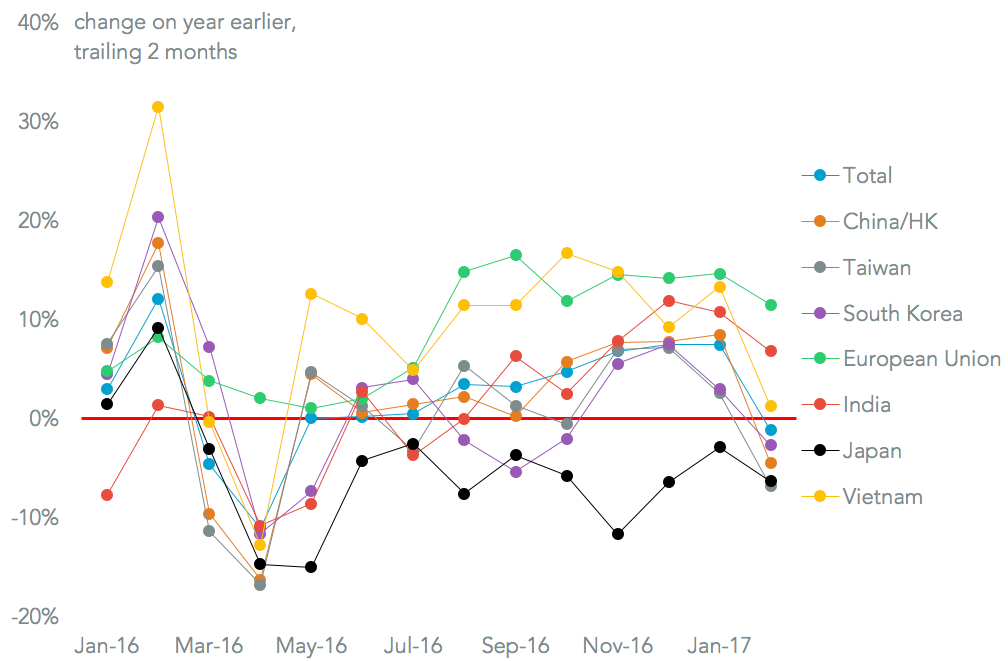
Geographically almost all of the U.S. major trading partners saw a decline in shipments in February that confirms this. Imports from China fell 14.8%, or a decline of 4.5% when taking a 2 month average to adjust for the new year. Similarly Taiwan experienced a 14.4% slide (6.8% adjusted), making the U.S. even less relevant as a major export market. Even in the case of the exceptions there was a marked slowdown, with shipments to the European Union increased 7.8% for the month of February – the slowest rate since July.
Source: Panjiva
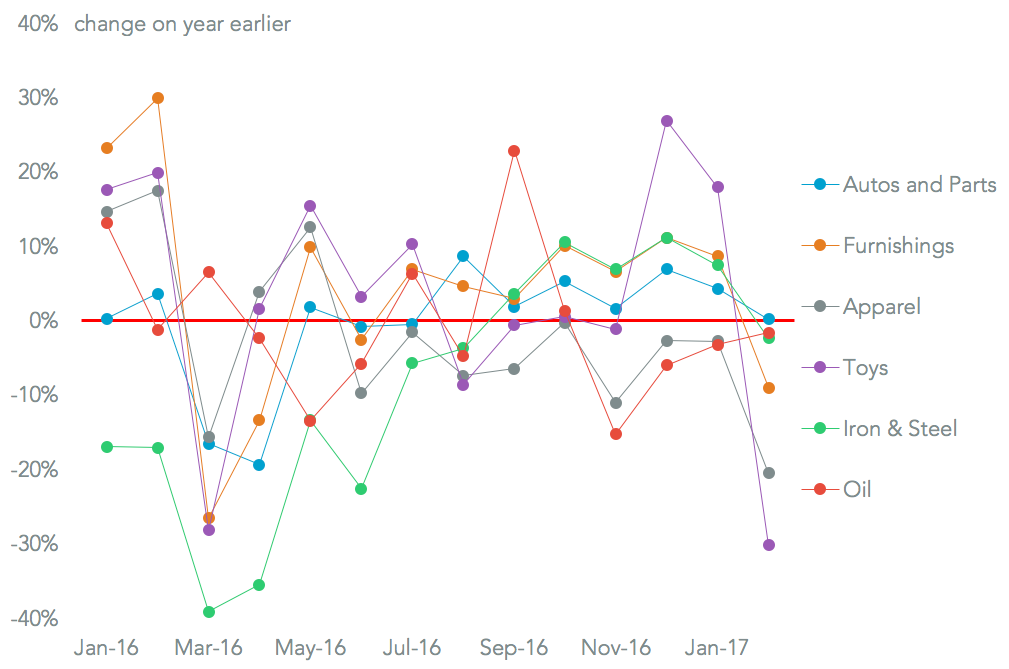
Looking across the six major seaborne products all either declined on a year earlier or saw a slowdown in growth. Apparel imports slumped 20.5% on a year earlier, the fastest rate of decline since at least 2008 on a preliminary basis, continuing a nine month trend of declines. The post holiday-rebound in toy imports also juddered to a halt, reflecting in part the high proportion of China-sourcing in the category.
In what may be music to the ears of the steel industry experience-heavy trade team the imports of iron and steel fell 2.4%, the first drop after six months of increases. Ironically, given all the attention President Trump has given the sector, imports of automotive parts and vehicles marginally increased by 0.2%, though that was the slowest expansion in seven months.
Source: Panjiva
Update 3/08: Second chart and prior paragraph updated to show 2 month trailing average