 En
EnThe U.S. Trade Representative has launched its annual review of trade in the past year and statements of policy planned for the coming year and beyond. Unsurprisingly the policy focuses start with broad principles outlined before and after the elections, as discussed in Panjiva’s 2021 Outlook.
The key priorities (in order) include: pandemic-related healthcare measures; “a worker centric trade policy“; the inclusion of environmental objectives in new and existing trade relations, potentially including carbon taxes; and “advancing racial equality and supporting underserved communities“.
From a functional perspective, retaining a hawkish stance regarding China is the number one priority with a commitment to address “coercive and unfair trade practices” using a “comprehensive strategy and port systematic approach than the piecemeal approach of the recent past” with the administration “committed to using all available tools” while “ensuring that China lives up to its existing trade obligations“.
The latter likely includes the Economic and Trade Agreement (“phase 1”) trade deal signed in January 2020 and where a six monthly review, scheduled for mid-February, appears to be behind schedule.
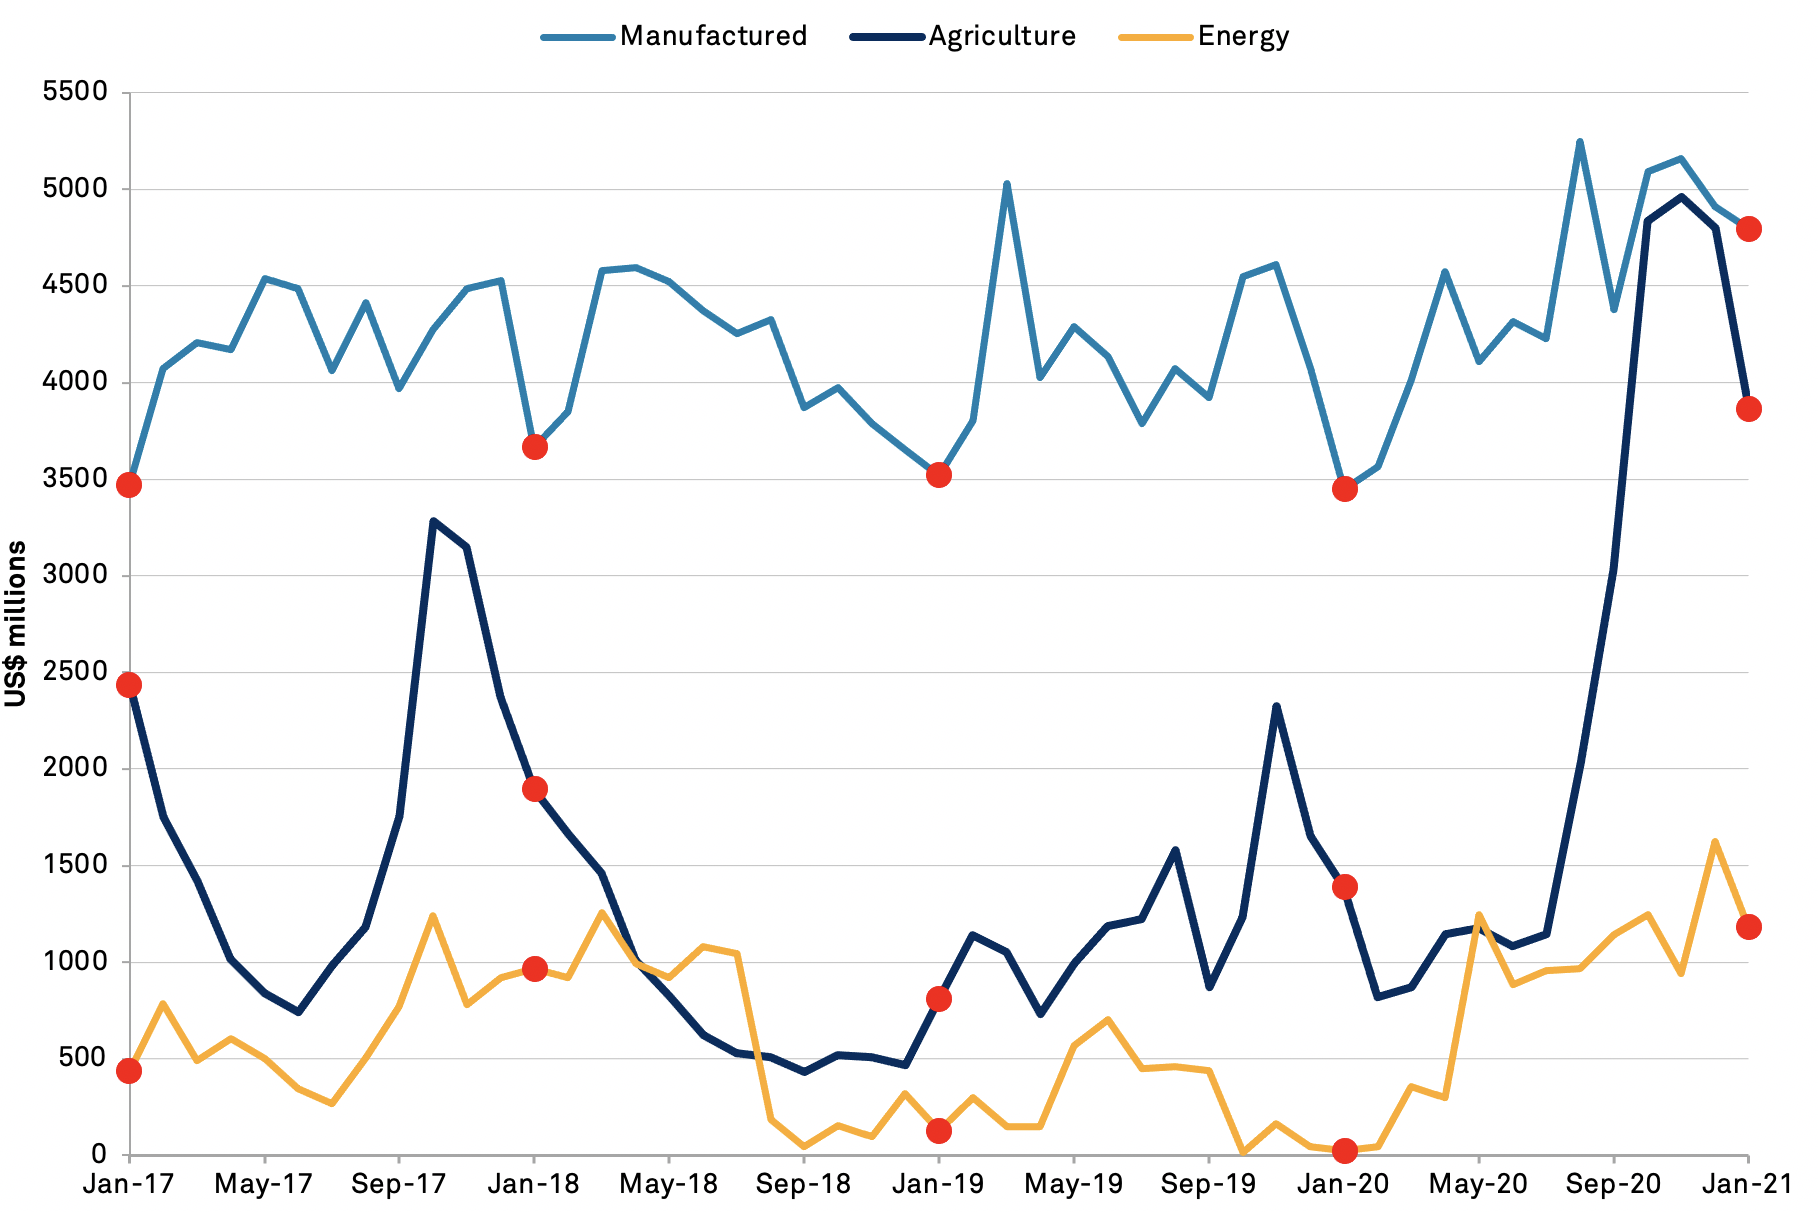
The purchasing commitments under the phase 1 trade deal cover 548 products across the industrial, agriculture and energy sectors with an implied monthly average value of exports of $11.9 billion per month in 2020 and $14.8 billion per month in 2021. Panjiva’s analysis of official data shows exports reached just $9.82 billion in January 2021, down from $11.2 billion per month on average in Q4’20.
 Source: Panjiva
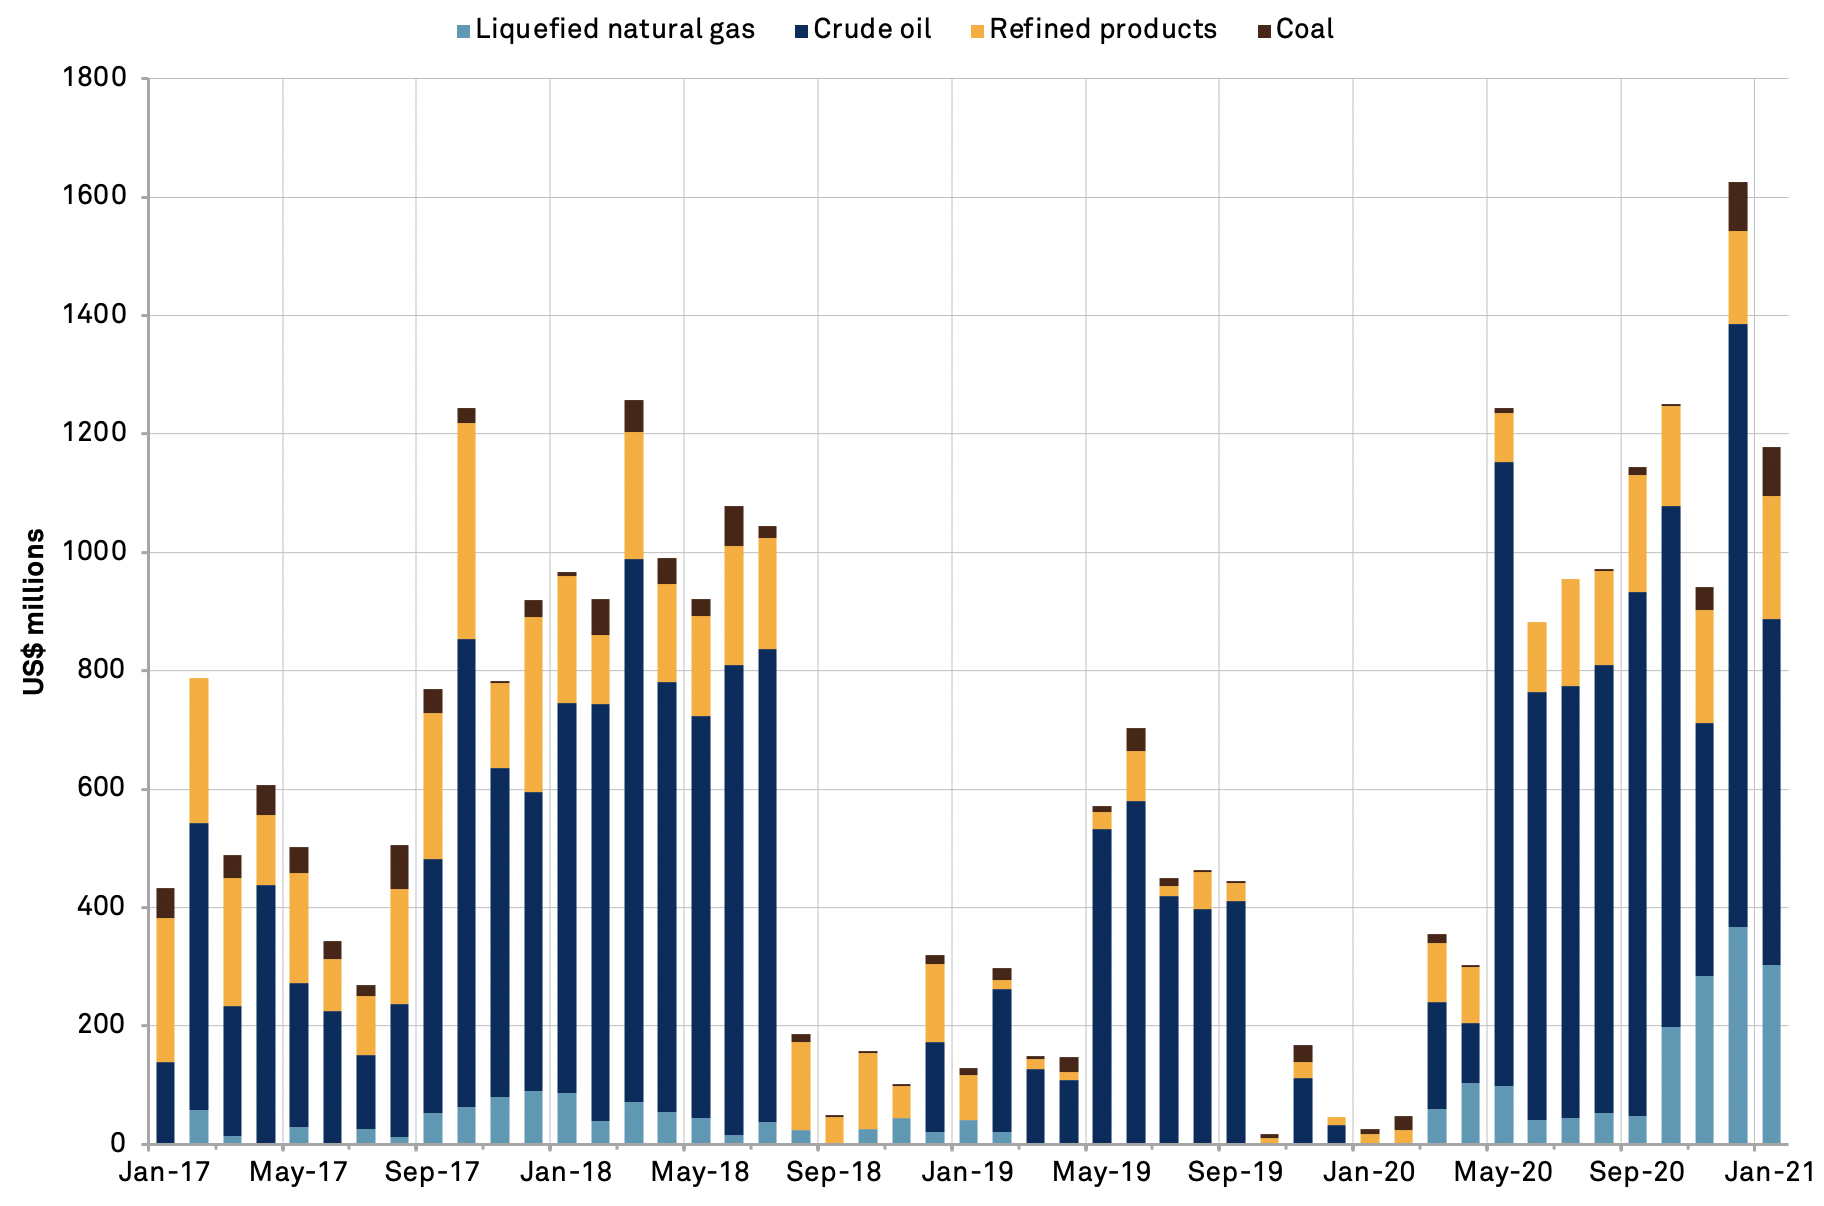
Exports of energy products in total were worth $1.18 billion in total in January, up by 172% versus 2017 but well below the $3.46 billion run rate for 2021 implied by the trade deal. A dip in crude oil exports to $585 million from $1.02 billion in December is a major culprit.
The text of the phase 1 deal allows for extenuating circumstances in market conditions. A collapse in the oil price in 2020 linked to the pandemic and a price war between Russia and Saudi Arabia dragged on energy commodity prices more broadly.
The crude oil price (WTI) in January was $51.8 per barrel, S&P CapitalIQ data shows, compared to $58.0 per barrel in January 2020 – a reduction of just 10.6% against the presumably “assumed level” – and have now reached $60 per barrel at the middle of February. Yet. Exports of both oil and liquefied natural gas will have fallen in February as a result of the winter storms in the southern U.S. and export ban in Texas.
Source: Panjiva
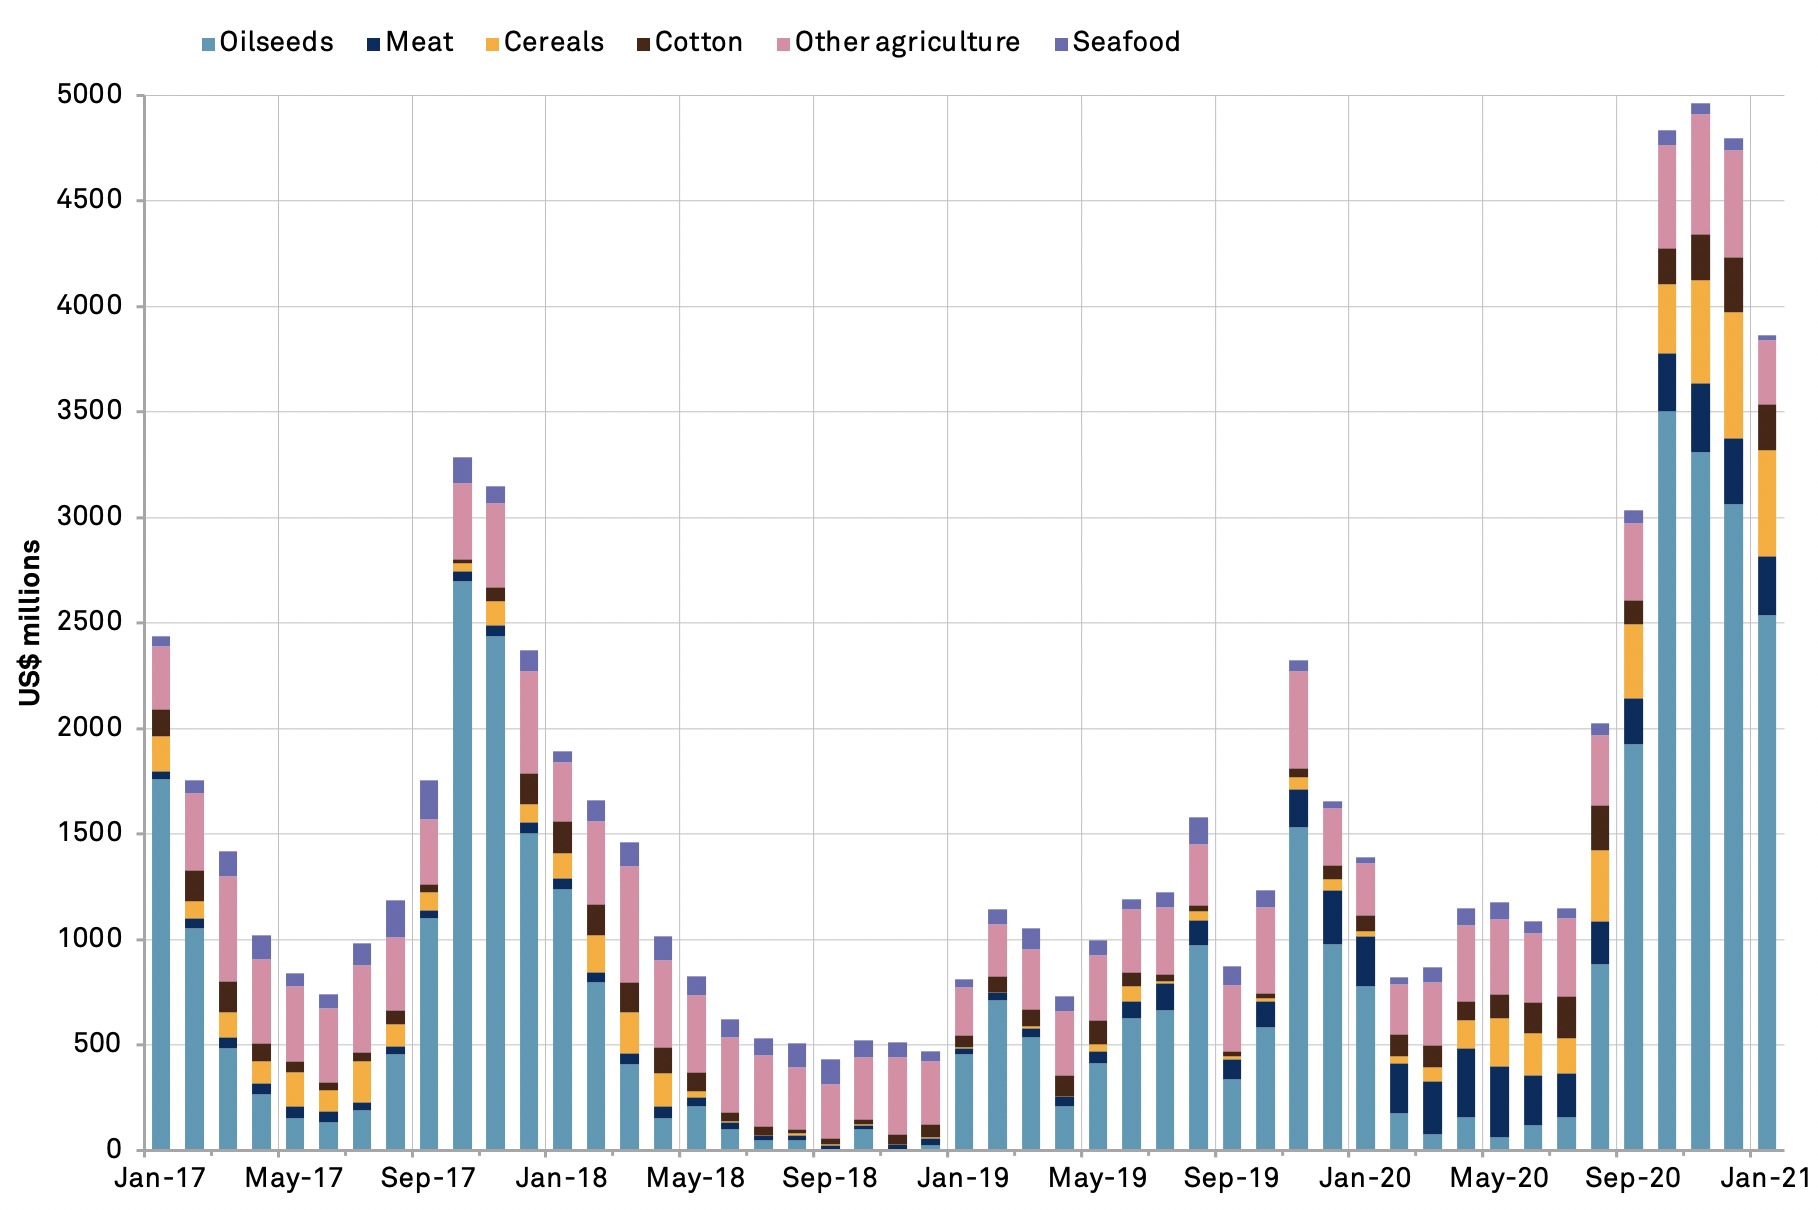
Agricultural exports reached $3.86 billion in the month, above the $3.37 billion targeted for 2021 on average. Yet, the soybean export season has already peaked, with exports in January reaching $2.54 billion compared to $3.50 billion in October. Panjiva’s data shows that total U.S. soybean exports in the off peak (February to August) season averaged $912 million per month in the 2013 to 2017 period. That will increase the pressure on Chinese imports of meat and cereals through the year and soybean exports next winter to meet the targets.
Source: Panjiva
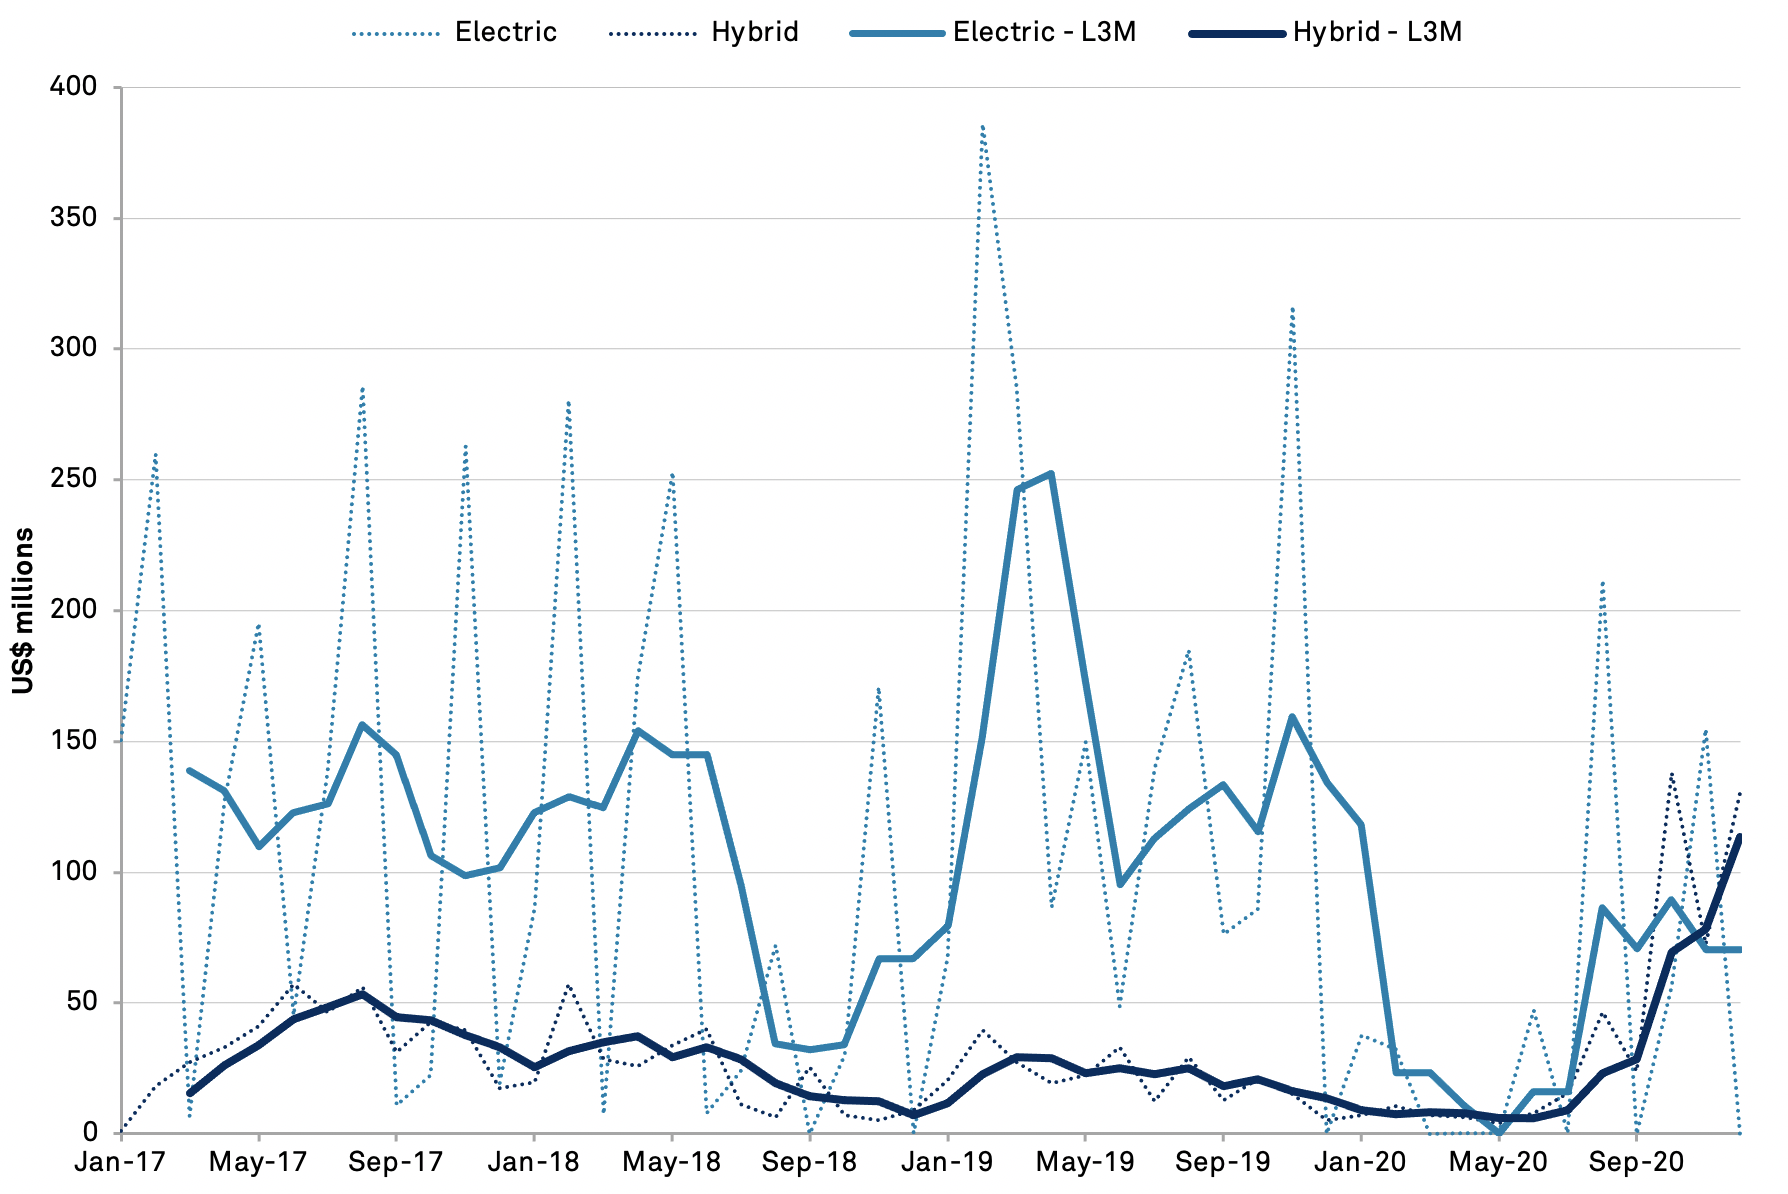
Elsewhere exports of industrial goods remain well below target at $4.80 billion versus a target for $7.96 billion. The main missing piece has been aerospace during the pandemic and Boeing’s woes, though exports of all vehicles have dropped markedly and were down by 12.4% year over year in January, likely reflecting the move to domestic production by Tesla in China. Panjiva’s data shows exports of electric vehicles to China dropped to $70 million per month on average in Q4’20 from a peak of $246 million in Q1’19 and $102 million in Q4’17.
Source: Panjiva


