 En
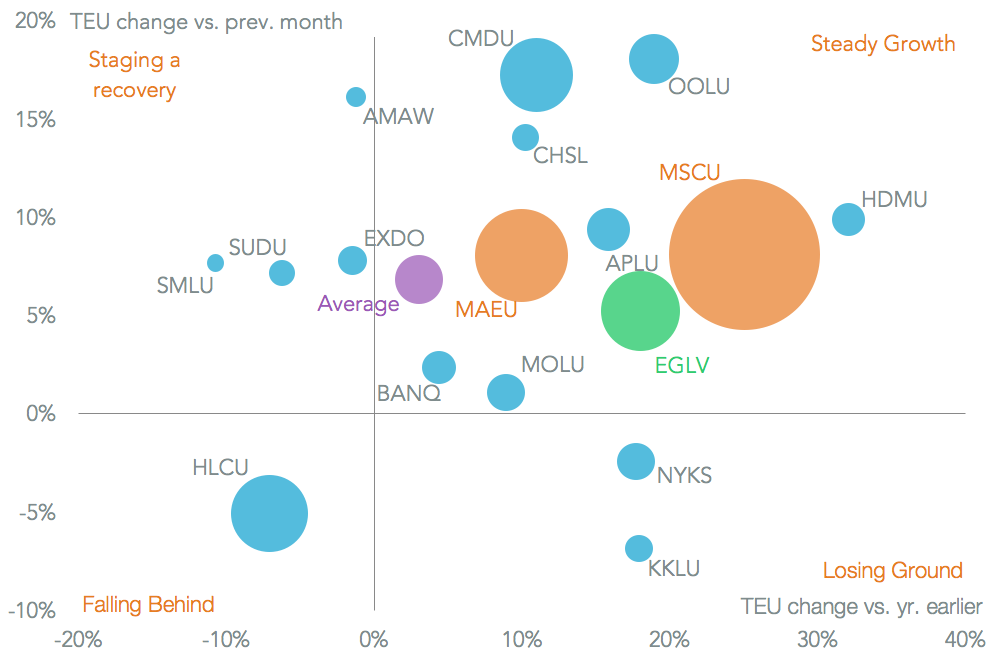
EnCarriers on U.S.-inbound shipping lanes experienced a third straight month of growth in May, Panjiva data shows, with a 3.0% increase on a year earlier. The second month of operations of the new shipping alliances saw a remarkable swing in market share towards the largest operators, with 14 of the top 20 seeing an increase in volumes handled.
Of the top five carriers only one (Hapag-Lloyd) saw an increase in volumes less than the industry average. MSC was particularly notable with a 25.0% rise in shipments to reach a new high. That in part reflects MSC taking on around a quarter of Hanjin Shipping’s capacity last year, as outlined in Panjiva research of February 17. A similar effect likely helped Maersk (10% increase in handling) and Hyundai Merchant Marine (32.1%).
Source: Panjiva
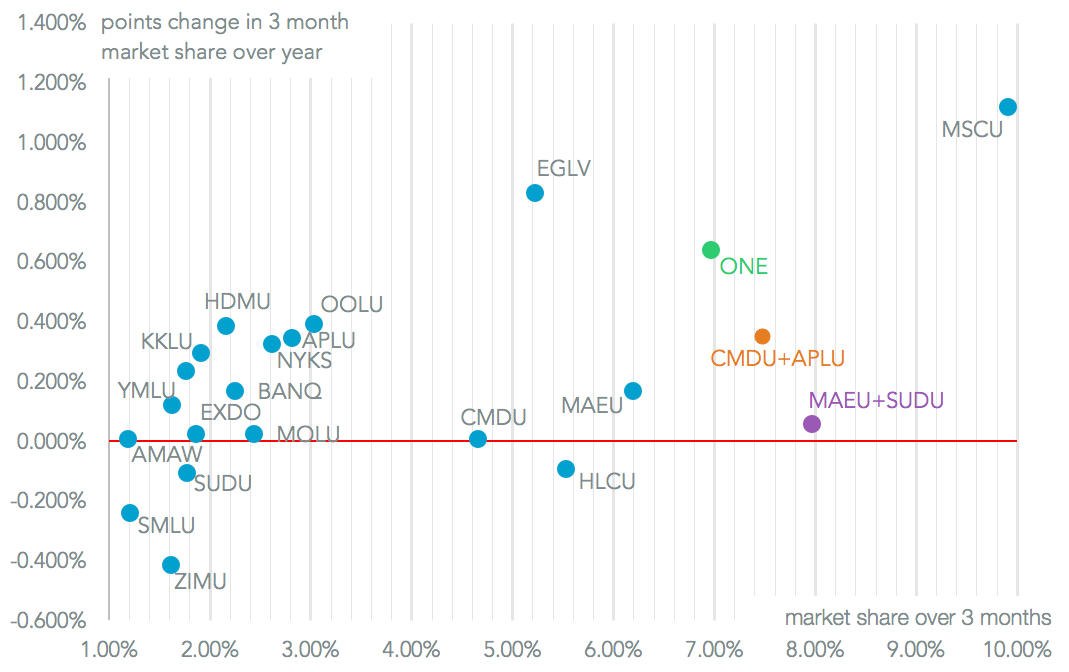
Hapag-Lloyd’s lower volumes resulted in a small loss of market share by 0.1% points to 5.53% points on a trailing three month average basis. It is still the fourth largest shipper – at least until the merger of the three Japanese shippers to form ONE is complete. It should also benefit from increased flows globally as it completes the integration of UASC. Also notable was the 0.83% points gain in market share by Evergreen, which reached 5.22%. That may reflect a rearrangement of volumes within the Ocean Alliance and is also reflected in its growth in market share in Brazil.
The operation of shipping alliances continues to prove controversial with the U.S. Congress which may look to restrict carriers to either be in an alliance or a price stabilization arrangement. The top 20 shippers added an aggregate 5.02% to reach 64.3% of U.S.-inbound containerized freight. All top 10 carriers are part of an alliance, as well as 15 of the top 20.
Source: Panjiva


