 En
EnThis report summarizes the nine research articles that make up Panjiva’s 2020 Outlook for global supply chains. You can read all the reports – as well as a review of 2019 and our prior Outlook analyses – in detail on our dedicated microsite.
It’s about time – the future for global supply chains
The past 10 years have seen a recovery in growth of trade after the great recession with a 4.4% annual growth in global exports. The decade saw the rise of China past the U.S. as a trader in goods, while the rise of populism versus globalization accelerated with the arrival of the Trump administration’s trade war with China. The restructuring of global supply chains has accelerated as a result.
Looking ahead there’s a mixture of short- and long-timeframe risks and opportunities to consider.
The U.S.-China phase 1 trade deal may prove difficult to execute – it requires an 88.4% rise in manufactured goods exports to China from the U.S. in 2020 versus 2017 – while enforcement consequences are unclear and a phase 2 deal looks unlikely given rising U.S. technology restrictions.
A potential U.S.-EU trade war could be the defining factor of 2020 with the greening of international trade likely to be embodied by the EU’s carbon border tax and insistence of Paris Accord membership for trade deal signatories. Ironically increased trade in natural gas, where the U.S. represents just 4.1% of EU imports, could salve the tensions.
The U.S. is also in the midst of trade negotiations with the U.K., Japan and India and may look to restrict imports from countries such as Vietnam, which have risen 24.8% in the past year. The elections loom but trade policy will remain volatile – most Democratic Party candidates are “tough on China” and strict on trade deals.
Elsewhere in the world globalization is alive and kicking with post-Brexit trade deals to be done, EU-Mercosur and China-Mexico deals to be done as well as the implementation of the African Continental Free Trade Area getting underway. Asia’s RCEP may be the biggest deal, driven by Japan which sends 44.6% of its exports to the RCEP group. The WTO’s future will remain unresolved.
Outside policy, the logistics industry has to deal with the implementation of new sulfur rules while also navigating forthcoming carbon emission regulations. Consolidation will remain key to efficiency gains, especially in forwarding where the top 10 firms on U.S.-inbound routes had a market share of just 14.1%.
While U.S.-China risks have dissipated, corporate supply chains continue to be restructured away from China while short-term strategies including tariff mitigation, pricing and inventory management remain important. Supply chains are also becoming less complex – the number of shippers per consignee on U.S. imports fell 3.5% for their peak.
Technology has held out the prospect of better visibility and increased efficiency for supply chains for several years. The fruits of developments in Internet-of-Things, data-science driven analytical techniques, blockchain technologies and (in the longer term) evolution of distributed manufacturing may begin to ripen in the coming couple of years. Cybersecurity risks rise with the developments of course, necessitating increased investment there too.
There’s no shortage of black swan risks including conflict in the Middle East, South China Sea and between India and Pakistan – India accounts for just 0.7% of Pakistan’s exports. Physical interdiction in the form of unmanned vehicle attacks and piracy remain a concern. The greening of supply chains is needed and could exert unexpected costs. At least the risk of recession remains low as the new decade begins.

Source: Panjiva
10 years in 10 charts: A decade of growth ends on a low note
The past decade has seen momentous changes in global supply chains. This report looks at 10 significant changes through the lens of Panjiva’s trade and supply chain data and considers the implications for the coming years.
Total global trade grew by 4.4% CAGR over the past 10 years, though that was flattered by the post-recession recovery – excluding that growth was an anemic 0.8%.
China passed the U.S. as an international trader in dollar terms in Jan. 2013 and is now just 0.2% smaller than the EU. China’s still only the third largest importer but it’s influence will likely grow.
The rise of populist politics has seen an increased growth in the use of tariffs, most notably in the U.S.-China trade war which has led to a 13.7% year over year drop in imports of tariff-beset products in the 12 months to Nov. 30.
Trade deals don’t last forever as shown by the renegotiation of NAFTA and the Brexit process. British industry is already reacting to the latter with a decoupling of industrial intermediate products with 52.7% of imports coming from the EU in the 12 months to Oct. 31 versus 58.8% in 2009.
Supply chains have reacted to lower labor costs and tariffs by shifting to emerging Asia export markets. Vietnam has grown quickest with a 16.1% compound annual growth in exports over the past 10 years versus 6.0% for the Philippines. Yet, that-hasn’t translated into faster GDP growth for Vietnam compared to the Philippines.
Industrial supply chains have also become more complex with an 8.3% rise in the average number of suppliers per S&P 500 company.
Those supply chains are also exposed to shipping disruptions as shown by the 2015 west coast U.S. port strike and the financial failure of Hanjin Shipping in 2016. The latter has also driven further container-line consolidation – the top 10 container-lines now account for 87.4% of U.S. seaborne imports from 64.1% in 2009.
The largest industrial supply chains are also going through industry-specific upheavals. U.S. shale oil and gas production has meant U.S. imports fell to just 101% of exports in the past 12 months compared to 471% at the start of the decade.
Finally, the automotive sector’s cross-border operations have continued to explode. U.S. imports of parts from Mexico rising 13.4% annually in the past 10 years while those from the EU climbed 9.4%.

Source: Panjiva
U.S.-China relations: Come for the commitments, stay for the enforcement
The U.S. and China have signed the long-awaited phase 1 trade deal, ending a process of escalation – which we’ve referred to as the Trade War Show – which has run since Aug. 2017.
The U.S. appears to make no commitments in the phase 1 document and is making only a modest roll-back to list 4A product duties from Feb. 14 – those cover $120.2 billion of imports in the 12 months to Nov. 30 where imports fell by 26.4% year over year in the three months to Nov. 30.
China’s commitments meanwhile are manifold, particularly in relation to intellectual property, restrictions on foreign investment and access to financial services. It’s the purchasing commitments however that may define the deal’s success or otherwise.
Panjiva’s detailed analysis of the 548 products covered shows the commitments will be far from easy to deal with. China has committed to importing $95.5 billion of manufactured products – ranging from industrial equipment to chemicals as well as consumer goods – in 2021. That represents an 88.4% uplift versus 2017, or $44.8 billion of extra imports. That could add 7.4% to U.S. exports of those products though many are bought by private enterprises that won’t be easily directed.
The manufacturing commitment also includes semiconductors – where the U.S. is trying to limit technology development – and aerospace where China is supporting its own industry. Imports of agricultural products need to reach at least $40.4 billion 2020, representing a 93.2% rise versus 2017. That would add 14.3% to U.S. agricultural exports though there could just be diversions from other countries plus the Chinese government has said it will only buy inline with market conditions.
Energy purchases are to reach $41.5 billion, representing a 443% rise – that could be easily met by diverting oil and LNG exports bound for other countries.
Services imports of $81.1 billion in 2021 would represent a 44.8% rise and represents the most ambitious and least tangible commitment – it will require the cooperation of U.S. financial services firms. The enforcement process will be key to providing certainty for supply chain planning across the U.S. and China.
In that regard tracking the purchase commitments should prove simple while the review process is clearly defined. However, timeframes and more importantly sanctions for review and non-compliance are by no means clear, leaving significant uncertainty about whether the deal may fall apart with little notice – indeed either party can withdraw with just six days notice.
Companies are likely to continue to reduce their exposure to China as a result, continuing an ongoing trend. Among more recent tariff applications, U.S. furniture imports from China fell to 44.4% of the total in the past 12 months from 49.6% in 2016. In apparel the ratio fell to 35.0% from 40.3%.
Phase two talks will likely focus on Chinese state subsidies and support for state-owned enterprises, as well as technological developments. On the latter there’s already signs of a hardening of the U.S. stance with State, Commerce, Treasury and Defense already acting to restrict Chinese access to U.S. technology.
Chinese firms have already accelerated their semiconductor imports from the U.S. with 32.3% year over year surge in the 12 months to Nov. 30. Finally, external risks to the deal are unlikely to come from the WTO – the deal may break its rules but dispute settlement is in flux – but rather from the U.S. election process where Democratic Party challengers may attempt to outflank President Trump in being tough on China.

Source: Panjiva
U.S.-EU relations: A trade war in waiting
A worsening of trade relations between the U.S. and EU could be the defining factor for global trade policy in 2020. Talks that started in July 2018 made little progress ahead of the arrival of a new European Commission as well as because of threatened, but not implemented, U.S. automotive tariffs.
The EU Trade Commission, Phil Hogan, looked for a “reset” in trade relations at meetings in mid-January, specifically including existing U.S. tariffs. U.S. Trade Representative Robert Lighthizer meanwhile has identified “basic trade problems” with the EU.
The U.S. will also focus on its trade deficit with the EU that reached $178 billion in the 12 months to Nov. 30, the second largest after China. The aerospace sector is already an area of conflict. The U.S. has already applied tariffs in a wide-ranging WTO case while the EU could move against U.S. aerospace exports worth $45.8 billion in the past 12 months.
A bigger issue will be EU plans to implement a digital services tax, with U.S. tariffs on French exports a potential catalyst for conflict. In the instance of an EU-wide DST, the U.S. would likely target the machinery and autos sectors for tariffs – representing 16.6% and 10.6% of EU exports respectively – as well as luxury goods with a potential toll for LVMH, Coty and Barry Callebaut.
Similarly, the EU’s new Green Deal will likely include a carbon border tax which could capture U.S. steel and aluminum exports worth $821 million and $875 million respectively including shipments by Kaiser and Arconic. Natural gas meanwhile may be an area of potential concord. The EU only takes 4.1% of its gas from the U.S., while the latter’s exports could more than double in the next two years.

Source: Panjiva
U.S. trade policy: New year, new frenemies
The Trump administration has already brought tumultuous change to U.S. trade policy since 2017. There’s likely to be little let up in 2020 with nine major issues to consider.
First, the November elections may shine a spotlight on trade. There’s been a 0.4% drop in exports to China in the 12 months to Oct. 31 for every percentage point President Trump won the state in 2016. The situation will be particularly interesting for Florida and Wisconsin which were +1% for Trump but have seen exports fall 35.8% and 20.4% respectively.
The phase 1 trade deal with China won’t necessarily lead to a more comprehensive phase 2 deal and will potentially degenerate into a form of decoupling. That’s already underway with changes in corporate supply chains – imports of list three products fell 35.4% year over year in November – while U.S. restriction on trade in tech including AI software being implemented.
Third, U.S.-Mexico-Canada Agreement is moving from ratification to implementation. Autos and specifically steel use in that industry will be particularly impacted. Weak demand for cars and pre-positioning for the new rules may have driven a 24.5% year over year drop in automakers’ seaborne imports of steel to the U.S. in the 12 months to Nov. 30, led by Ford and Toyota.
The most significant issue is a potential U.S.-EU trade war over digital services carbon border taxes. Luxury goods have been the main loser so far and may continue to be so. Imports of beverages worth $11.7 billion lead way with still-robust growth of 6.1% including LVMH, Diageo and Pernod.
A U.S. trade deal with the U.K. may stumble in the healthcare sector given popular support for the British National Health Service and the risks of conflicting regulations with a U.K.-EU deal. U.K. exporters will also want improved access to the U.S. after pharmaceutical exports from the U.K. to the U.S. fell by 10.3% and implants down 18.5% in the past 12 months to the detriment of GlaxoSmithKline and Smith & Nephew among others.
Sixth, a U.S.-Japan trade deal is meant to become more comprehensive this year. Japan’s insistence on zeroing autos tariffs will be a major problem as well as harmonization of USMCA and CPTPP trade deal terms given Canada and Mexico are in both. Japanese auto parts exports to Mexico are already in decline with a 12.1% year over year drop in the 12 months to Nov. 30, led by a drop in shipments by Nissan and Mazda.
A brand-new deal between India and the U.S. may focus on an early win of a handful of tariff reductions in India for farm products – particularly important for the Trump administration in an election year. The biggest wins in reducing the dollar value of tariffs could include cotton and nuts with tariff rates of 25% and 41% respectively. India has, however, shown little desire to cut tariffs in its other trade negotiations.
The Trump administration may also turn its attention to the “mini Chinas” that have been winners from the U.S.-China trade war. The largest in dollar terms was Vietnam with a 24.8% surge in exports to the U.S. in the 12 months to Nov. 30, followed by Cambodia with a 36.8% expansion. That could lead to further section 301 tariffs – the mechanism used against China – or a wider Reciprocal Tariff Act. The risk alone has already led many Asian countries to use self-defense strategies such as cracking down on transshipments from China.
Finally, there are ongoing reviews of the Generalized System of Preferences access to reduced tariffs for emerging markets. The GSP covered $21.3 billion of U.S. imports in the 12 months to Oct. 31 after increasing 7.1% year over year. Thailand was most exposed with GSP representing 16.9% of its exports to the U.S., followed by Indonesia and Brazil.

Source: Panjiva
Global trade policy: Globalization alive and kicking
Global trade policy has faced upheaval at the hands of the U.S., but the rest of the world is still plodding on with the multi-year process of trade liberalization and dealmaking. There are eight regions to watch in 2020.
The EU, aside from dealing with Brexit, is negotiating deals with China, Mercosur, Australia, New Zealand, Mexico as well as implementing a new “trade enforcement” process to monitor existing deals. A revised deal with Mexico is close to completion after an agreement in principle was reached in 2018.
The largest potential Mexican export beneficiaries may be electronics exporters such as Samsung Electronics and LG Electronics. Mexico’s exports of TVs and monitors represented just 0.1% of EU-bound exports versus 2.4% of exports to the rest of world ex NAFTA. Similarly auto parts may benefit from liberalization in representing 4.5% of exports to the rest of the world versus 2.7% to the EU, potentially helping Nissan and Volkswagen.
The number one job for the United Kingdom will lie in securing a post-Brexit trade agreement with the EU, but it’s unlikely to be anything more than a tariff-related deal given the short timeframe involved.
A U.K. deal with the U.S. is next most important given it represented 16.2% of Britain’s exports – though it will be controversial in terms of healthcare and agriculture. Deals with China and Japan, representing 5.8% and 2.5% of Britain’s exports respectively, will also be vital.
The Chinese government will look to build new trade deals to bolster export growth which slowed to 1.5% year over year in the 12 months to Oct. 31 excluding the U.S. A deal with Mexico could be attractive but will run afoul of U.S.-Mexico-Canada Agreement rules.
India is likely to continue to be protectionist in general, though it may seek a trade deal with U.S. having failed to take advantage of the U.S.-China trade war. India’s exports to the U.S. rose by just 5.7% versus 9.5% and 28.9% for Bangladesh and Vietnam respectively.
More broadly in Asia the RCEP trade deal is doing better than expected with the major economies well invested. The region was equivalent to 44.6% of Japan’s exports and 29.6% of China’s in the past 12 months to Nov. 30. Both are facing slowing exports but political issues such as Japan-South Korea relations and South China Sea claims will be stumbling blocks.
Latin America’s biggest opportunity comes from the EU-Mercosur trade deal, though environmental policy is in the way despite declining trade between the two. The biggest challenges are intra-Mercosur frictions as well as the future of Venezuela. The latter’s imports are recovering with a 422% year over year surge in 3Q resulting from higher food shipments from Mercosur and China, but they are still only a fraction of earlier levels.
The African Continental Free Trade Area provides one of the brightest opportunities for expanding trade. It came into effect in 2019 after intra-Africa trade between the southern and northern states with those in central African states surged 14-fold in 2018.
Finally, resolving the future of the World Trade Organization’s dispute system will likely prove intractable this year, though that won’t prevent new filings or countries using parallel processes to resolve their differences. The key will lie with the EU and U.S. as the largest “users” of the WTO reaching a deal.

Source: Panjiva
Logistics in 2020: Delivery in doubt
The logistics industry faces a series of challenges in 2020 which have their roots in a period of upheaval from the past three years. Container shipping rates start the year at their highest since April 2015, but much of the improvement is down to higher fuel costs.
Indeed, S&P Global Platts data shows bunker-excluded container rates fell to $852 per FEU on Asia-to-Europe lanes in 4Q compared to $924 per FEU a year earlier due to the need to use low-sulfur fuel.
Further cost increases due to EU regulations of carbon emissions also face the industry though the impact on costs could be more modest than for sulfur, at least initially.
While container line profitability improved in 3Q 2019 to an 11.1% EBITDA margin that included a benefit from lease accounting changes at Maersk and Hapag-Lloyd and only leaves the ratio at 3Q 2017 levels.
The shipping industry may therefore need to cut costs. Improved productivity is one answer. The ratio of growth in shipping employment in the U.S. to shipping volumes improved by 3% points per year in the 2011 to 3Q 2019 period, but reversed by 8% points in 4Q 2019. Yet, cutting headcount to compensate could generate labor unrest.
Consolidation may be another route to improved profitability. The container-lines’ consolidation is already done – the top 10 liners represented 87.4% of U.S. inbound shipping in 2019, but in the freight forwarder sector the ratio is just 14.1%.
Consolidation between freight-forwarders – seen in the DSV-Panalpina merger in 2019 – as well as between container lines and forwarders, shown by Maersk and CMA-CGM, may make sense if the right mix of seaborne, land and airfreight services can be achieved on top of providing geographic diversity. In terms of the latter a combination of Europe-centric operators such as K+N or DB-Schenker with Asia specialists such as Honour Lane or Kerry may make sense.

Source: Panjiva
Supply chain strategies: Fighting on several fronts
Corporate supply chain managers have had to make strategic decision making in the phase of the uncertainty generated by the U.S.-China trade war in the past two years.
Looking ahead they face a widening number of challenges including: the implementation of the phase 1 U.S.-China trade deal trade deal; a potential trade conflict between the U.S. and EU; as well as trade liberalization elsewhere in the world.
Businesses generally now see trade policy volatility as business-as-usual with just 20.9% of firms discussing tariffs or Brexit in conference calls during 4Q. That was the lowest since 2Q 2018.
There are at least five main corporate strategies for dealing with tariffs. Lobbying and appeals for exemptions from tariffs will remain vital, though only 3.1% of appeals against U.S. list 3 tariffs on Chinese exports have been accepted. Those that have been successful have had strong political positioning. Inventory building ahead of new tariffs is largely a spent force, with U.S. inventory growth of 2.8% year over year in November being the slowest since July 2017.
Inventory growth may fall given U.S. seaborne imports dropped 8.5% year over year in December. That said, companies such as Pernod Ricard are still using inventory management as tariffs spread as a result of deteriorating U.S.-EU relations.
Tariffs are paid by importers but the economic burden is shifting. U.S. import prices from China fell 1.8% in December, though producer and consumer price inflation are increasing, suggesting that some of the tariffs are being paid for by consumers. Consumer firms including Best Buy, Wolverine and Costco put prices up.
Supply chain restructuring can take years rather than months to apply. However, there is a continuation of an apparent “anything-but-China” shift that has also been driven by cost cutting and market localization and has simply been accelerated by tariffs.
Some companies have moved rapidly. Giant’s share of bicycle shipments from China to the U.S. fell to 43.9% in 2019 from 89.1% in 2016 while retailers like Costco have moved more slowly. Reacting to a U.S.-EU trade war may be more complex.
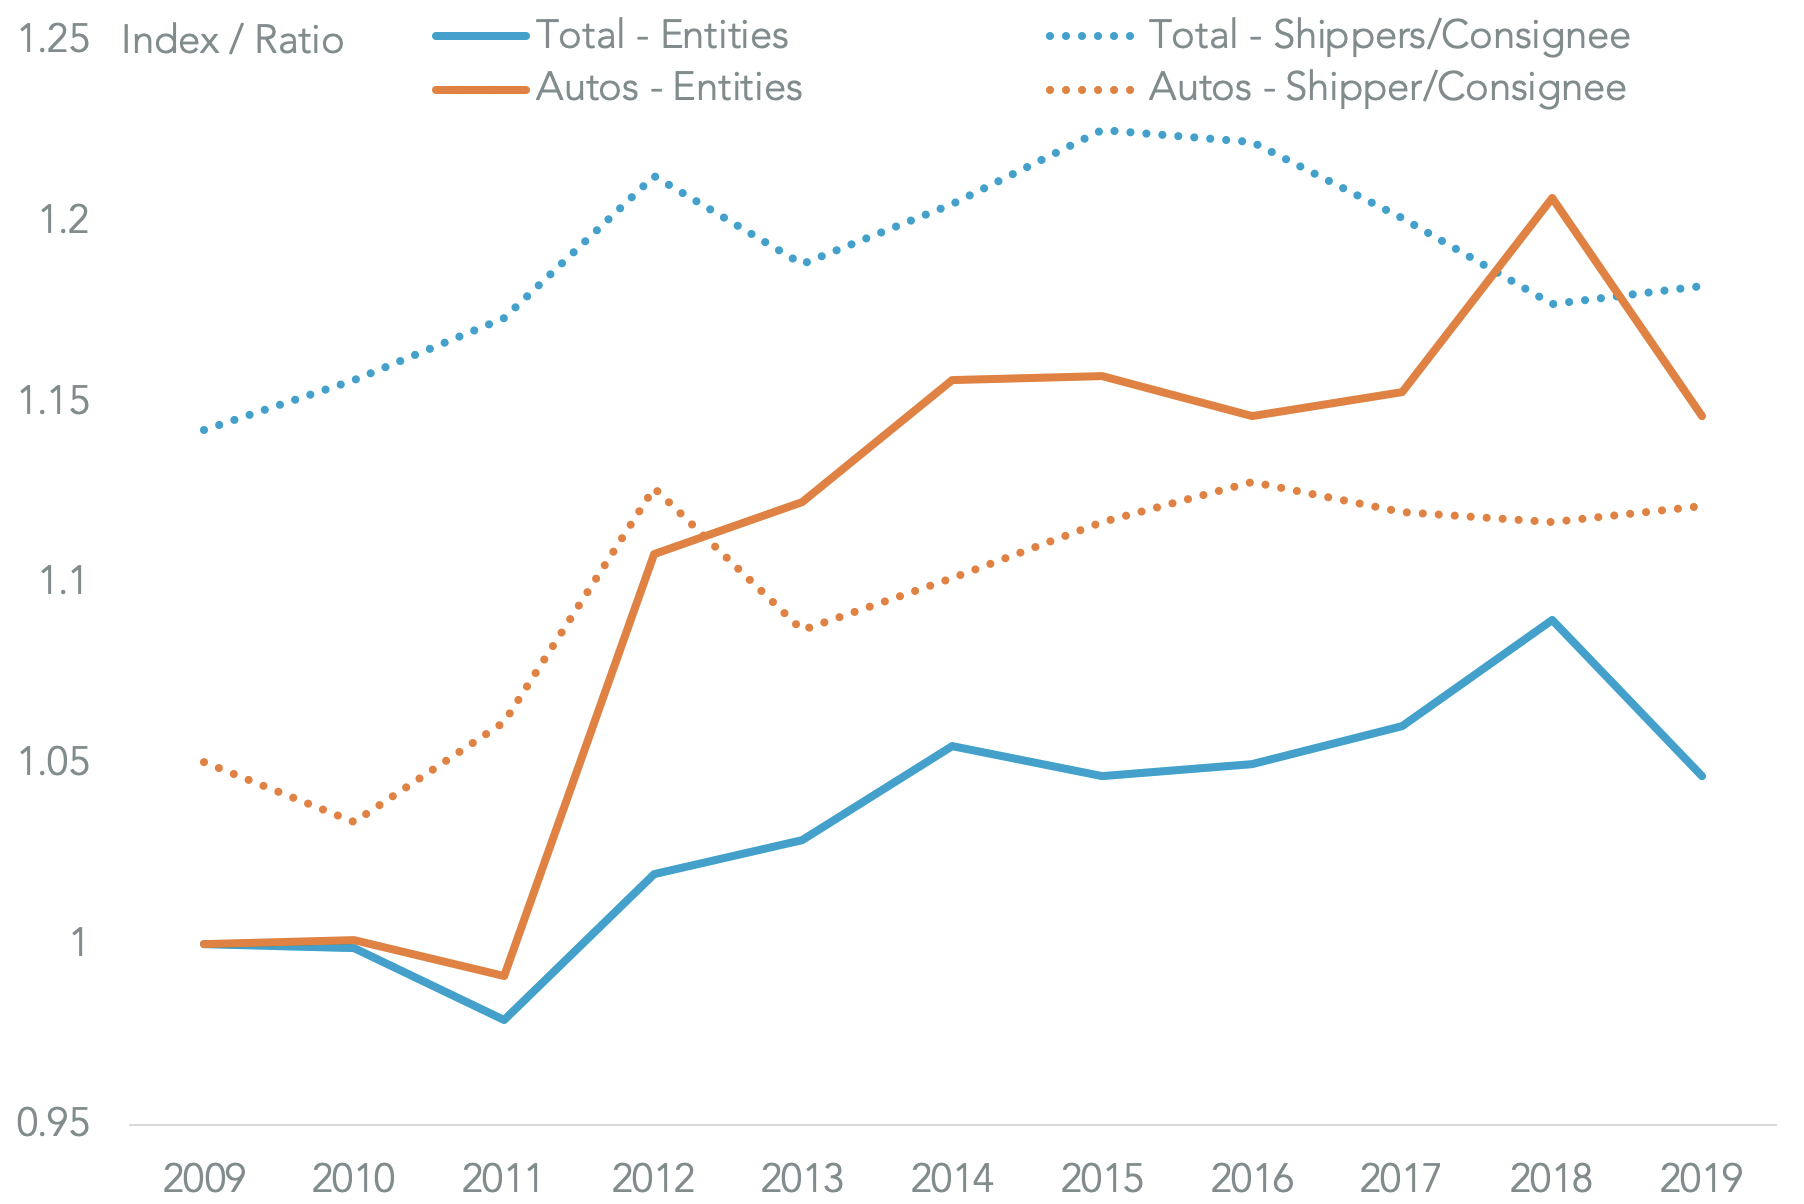
Over the longer-term, supply chain flexibility is key to dealing with uncertain trade policy. That said, risk managing diversity in supply needs to be offset against unnecessary costs. U.S. supply chains may already have passed peak complexity. The number of shippers and consignees using seaborne trade rose by 9.0% in 2018 versus 2009 but has since fallen by 4.0% in 2019 versus 2018. Similarly the average number of shippers per consignee increased to a peak in 2015 but has since fallen by 3.5%.
Source: Panjiva
Supply chain technology: Seeing clearly, reaching further
The old ways of running supply chains – including paper bills of lading and manual tracking – are rapidly becoming obsolete. New technologies are allowing benefits including increased visibility into supply chains while increased efficiency in operations can cut costs as well as greenhouse gas emissions. The latter can be significant given shipping alone represents 3.1% of global carbon emissions.
The development of the Internet of Things will result in 13.8 billion endpoints by 2024, a large proportion of which will provide valuable supply chain data. The resulting data explosion will create huge demand for AI and machine learning skills. Hiring will become a major issue as firms across the supply chain – including H&M for example – look to build their skills base. Indeed, around 84% of companies in a 2016 survey were already finding hiring challenging. U.S. employment in “information services roles” has grown 8.3% annually in the past three years whereas the logistics sector overall grew by just 3.3%.
The use of node-and-edge graph theory to construct supply chain network graphs can also be effective in discovering unknown weaknesses. For example “supply chain diamonds” can occur where an apparent diversity in first tier suppliers hides a dependency on a single tier two supplier.
Data on local demand combined with smaller and more agile manufacturing systems may lead to another round of supply chain restructuring including re-onshoring. Investments are a long-term process there – U.S. imports of industrial robots climbed 8.3% year over year in 3Q.
Blockchain technology is finding increased relevance in providing enhancements in trade financing and logistics paperwork. One of the most widespread so far is the Tradelens platform which currently has partnerships in ports covering 43.4% of U.S. imports.
Finally, the increased use of digital systems – including Internet of Things – has opened up more vectors for cyber-attacks. These have already beset logistics operators including Maersk and FedEx while globally cyber-security attacks continued to increase in 2019.

Source: Panjiva
Black swan risks: The year it might yet all go wrong
There’s no shortage of black swan risks – low probability, high impact events – that can lead to physical and / or financial disruption of global supply chains in 2020. We identify eight examples.
A contested result to the U.S. election could cast doubt over the direction of trade policy and may cause a pause in business decision-making, dragging on activity and investment. It would at least come during the off-peak shipping season with 1Q U.S. imports having been 12.8% lower than the annual average in the past five years.
Protests in Hong Kong in 2019 raise the risk of Chinese military intervention and resulting removal of the city’s special trade status with the U.S. That could disrupt the supply chains of over 36,000 U.S. importers including retailers such as Walmart and consumer goods suppliers such as Mattel.
Conflict risks involving China also include the nine-dash maritime claims in the South China Sea and relations with Taiwan. U.S. involvement may be limited by a desire to preserve the phase 1 trade deal. Economic restraints on North Korea remain in Chinese hands given its continued $2.4 billion trade surplus with the DPRK while maintaining UN sanctions.
Conflict in the Middle East is more of a grey than a black swan after events in 2019. However, closure of the Straits of Hormuz and increased economic pressure on Iran by the U.S. have room to disrupt supply chains. Action against alternative payment mechanisms could hurt Indian exporters who relied on $4.1 billion of exports to Iran in the 12 months to Sept. 30, including rice.
Relations between India and Pakistan worsened in 2019 and always carry the risk of conflict. The two countries have minimal trade – India represented just 0.7% of Pakistan’s exports in the 12 months to Oct. 31. Supplies of textiles and apparel from Pakistan to the EU and U.S., including purchases by Walmart and Adidas among others could be disrupted by a conflict.
The power of drones to disrupt supply chains was shown by attacks on Saudi oil fields in 2019. That comes on top of traditional terrorist and piracy risks which can increase insurance costs and disrupt specific supply chains. Piracy in Asia rose 19.5% year over year in 2019, focused on shipping in the Straits of Malacca and Singapore.
Climate change related policies may finally have an impact on the shipping industry. Trucost data indicates global maritime shipping emissions reached 1,250 tons of CO2 per million dollars of revenue in 2018. As a result each $10 per ton of CO2 emissions pricing could cut industry profit margins by 1.3% points, compared to an EBITDA margin of 11% in the 12 months to Sept. 30.
The prospects of a recession remain low – indeed S&P Global Ratings see 2020 as featuring “unexciting steady-state growth in many advanced economies”. However, that should be set against the backdrop of a 2.1% year over year drop in global exports in the 12 months to Nov. 30.

Source: Panjiva


