 En
EnThe U.S. government will carry out a review of, and recommendations for policy relating to, the state of the U.S. defense manufacturing industry following an Executive Order issued by President Donald Trump. While not specifically aimed at trade in goods, there is a clear reference in the Order to loss of manufacturing jobs and the risks of “long” (read international) supply chains. Furthermore NTC Director Peter Navarro has referred to risks to supplies of rare earths (used in electronics) and components such as LCD panels, Fox News reports.
The report has a 270 day deadline (ie April 2018) but will likely be completed sooner. Notably it may partly overlap with the “section 232” reviews of the national security aspects of the steel and aluminum industries.
Rare earth elements are a case in point. The Chinese government restricted exports of the materials, used in permanent magnets in a number of industrial settings, as outlined in Panjiva research of December 10. U.S. imports of the materials used in rare earth magnets have fallen 5.0% in the past 12 months on a year earlier, and 41.0% on three years earlier, Panjiva data shows. Imports of the completed magnets themselves increased 8.9% and 161.4% over the same periods, indicating an increased reliance on foreign companies for supplies of the components. China as a proportion of the total reached 62.5% in the 12 months to May 31 vs. 42.1% in 2012.
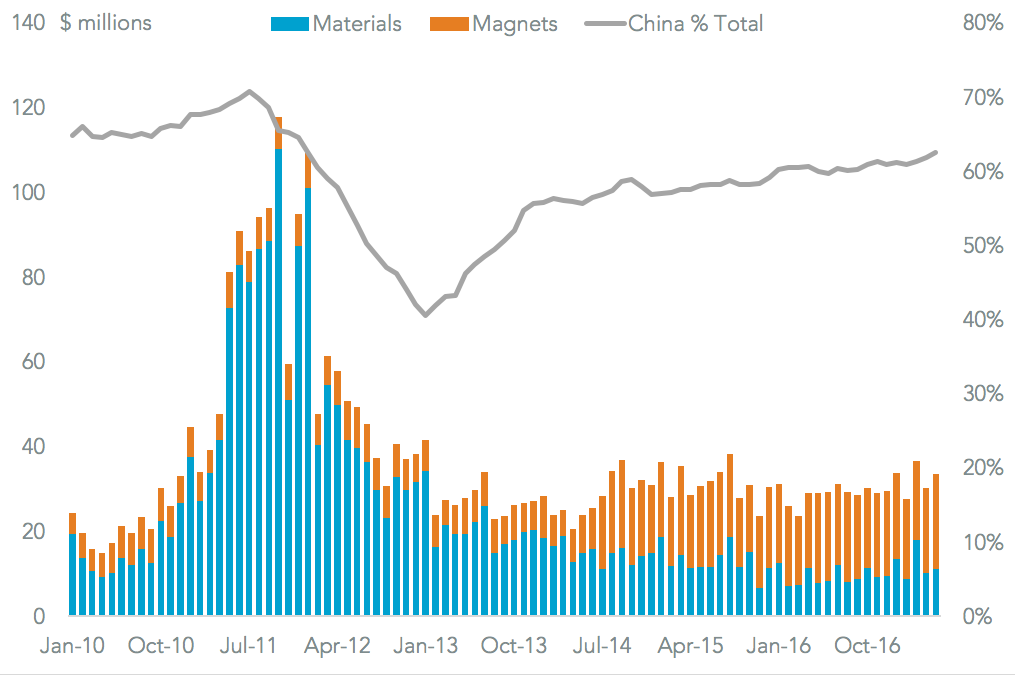
Source: Panjiva
As well as impacting upon U.S. preparedness, there will also be implications for the $10.3 billion weapons export industry. This has already been in decline after exports of weapons and military vehicles fell 6.8% for the past three months on a year earlier while military aircraft saw a slide of 49.8%.
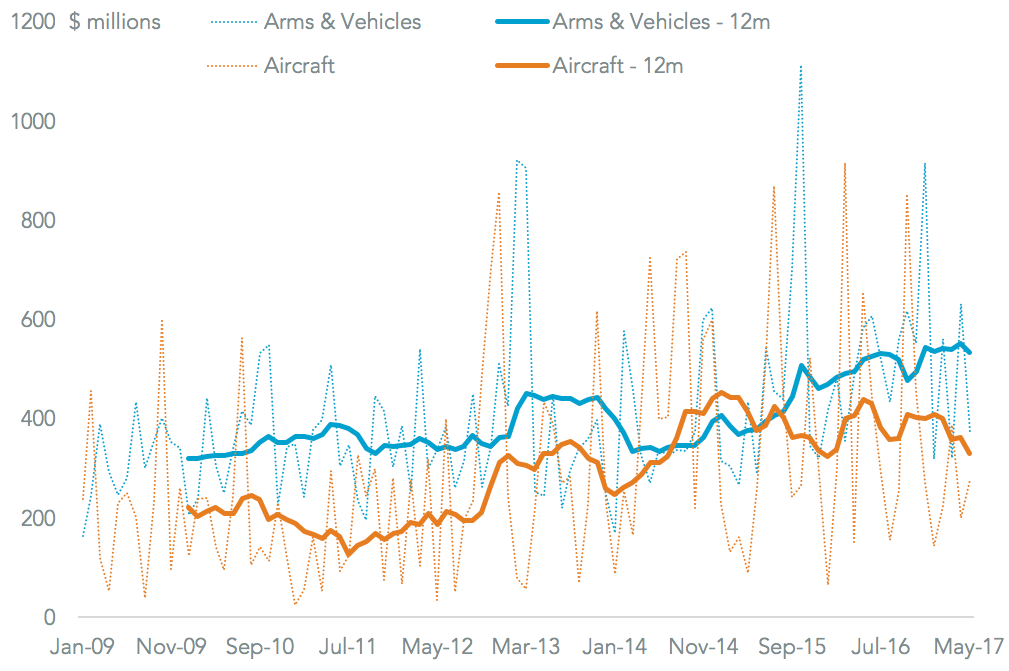
Source: Panjiva


