 En
EnContainer handling at the ports of Seattle and Tacoma fell by 5.8% on a year earlier in August, Panjiva analysis of Northwest Seaport Alliance data shows. That’s a marked turnaround from the 5.5% improvement in the prior three months to July 31 and included a slump in both imports of loaded containers (down 3.5% from growth of 11.4%) and exports (down 3.2% from an 8.1% improvement). A long-term downtrend in domestic shipments to Hawaii and Alaska also hindered progress.
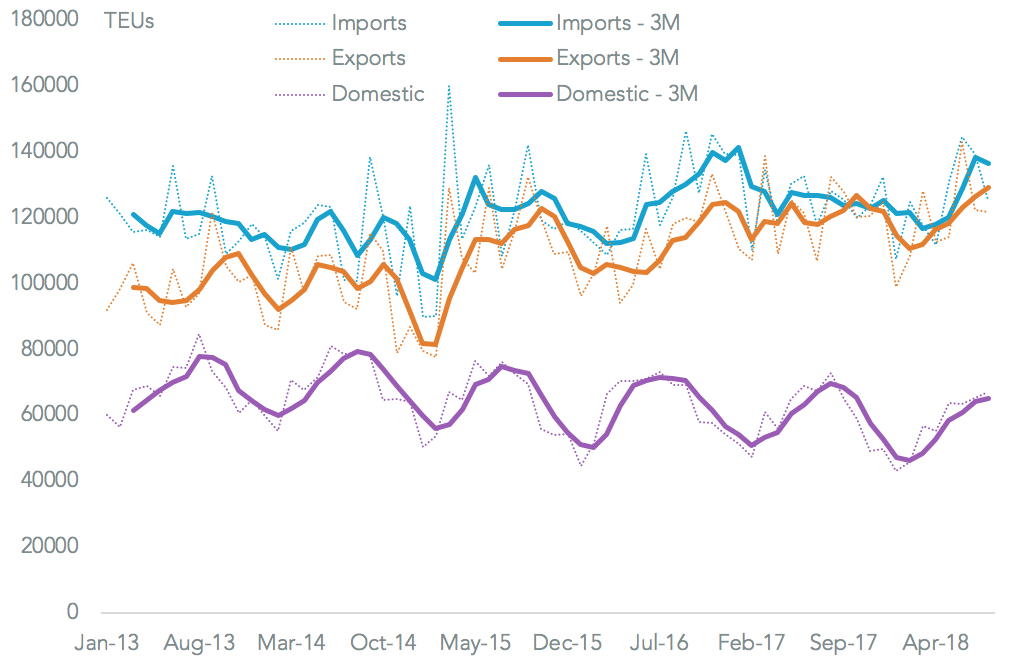
Source: Panjiva
Panjiva data shows that the decline in imports is largely due to a 10.6% slide in shipments originating in China. That in turn is likely to be the result of the initial round of tariffs applied by the Trump administration against Chinese exports. With $34 billion covered from July 6, an extra $16 billion from August 23 and a further $200 billion from September 24, as outlined in Panjiva research of September 18, the negative impact on Chinese volumes is likely to become more extensive in the remainder of 2018.
China is not Seattle/Tacoma’s only problem though with volumes originating in South Korea having fallen by 25.7% and Japan by 23.2%. The port is becoming more reliant on shipments from across North America (Canadian volumes rose rose 52.0%) and emerging Asian markets (Vietnam up by 9.9%).

Source: Panjiva
Nonetheless, with 48.7% of volumes headed into the two ports coming from China there extended range of tariffs will have a significant impact on the port. In terms of electronics and electrical goods that lead the $250 billion of Chinese products so far (i.e. HS 84 and 85) the leading shippers to the port from China include printer maker Fuji Xerox (3.2k TEUs shipped in the past 12 months), Hitachi Construction (1.0k TEUs), heating systems producer Midea (1k TEUs) and electronics manufacturer Jabil Circuit (0.9k TEUs).

Source: Panjiva
Seattle and Tacoma are by no means the only ports affected by the outlook for lower activity resulting from the U.S.-China trade war, though it is the worst of the west coast ports to have reported so far after LA and Long Beach reported 2.5% and 1.9% declines in total traffic respectively in August on a year earlier while Oakland experienced a 6.7% rise. Overall west coast U.S. container handling fell 1.9% on a year earlier to 2.328 million TEUs in August, that was below July’s level for the first time since at least 2013.

Source: Panjiva


