En
EnThis report avoids the usual “top 10 of the year” countdown to instead pick one of the most read Panjiva Research reports from each month to provide an analysis of some of the key events for the global logistics industry in 2017. You can find a year’s worth of most-read research drawn from over 1,700 reports on a month-by-month basis here. Did we miss anything you want to know more about – email us via support@panjiva.com and let us know.
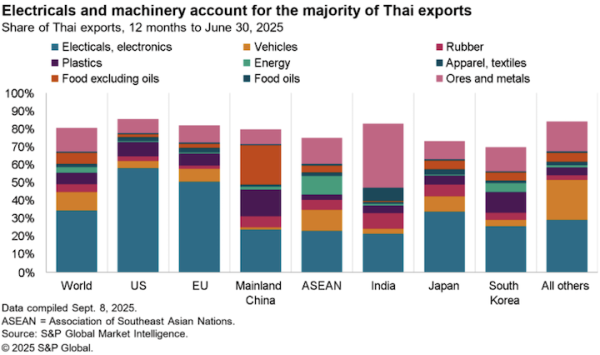
#1 Maersk’s Alibaba deal for LCLs (Jan 23)
Maersk’s deal to sell empty container space via Alibaba to Chinese customers may start a process of reducing business available to freight forwarders. Panjiva data shows that there were a total of 699,000 less-than-container shipments from China to the U.S. in the past 12 months. This was equivalent to 18% of all shipments by number (not volume), and growth in LCL shipments has outstripped the total industry until recently.

Source: Panjiva
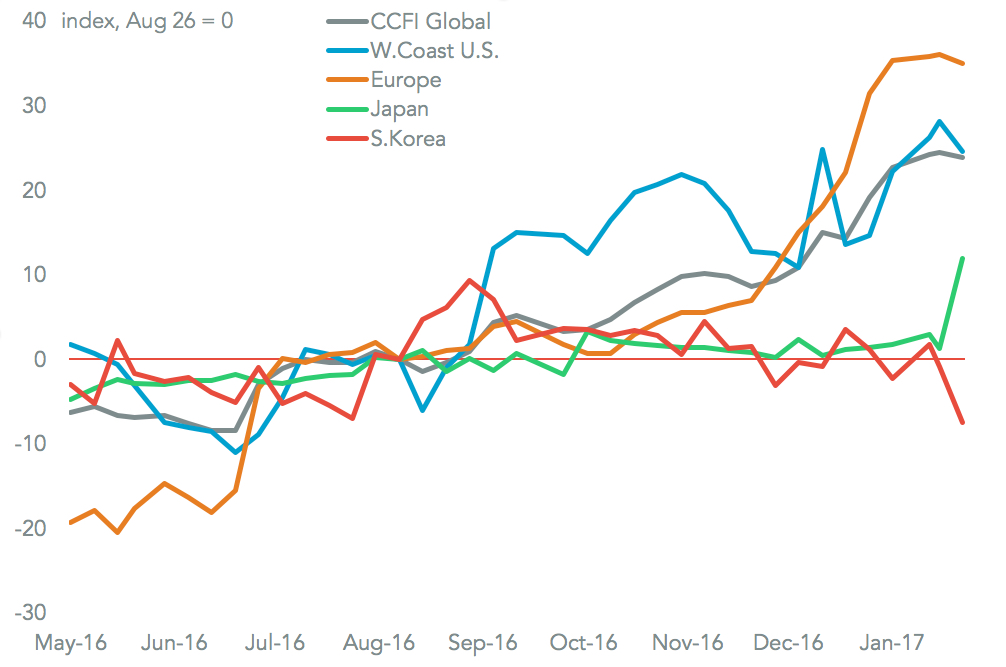
#2 Has Hanjin’s demise helped? (Feb 17)
Hanjin Shipping has finally entered formal bankruptcy, but has this changed much? Global container rates are 24% higher, but while long-haul rates have increased those within Asia are largely unchanged. Panjiva research highlighted back in August that the industry needs less capacity, not fewer operators to succeed. In that regard much of Hanjin’s capacity has been reallocated – for example one quarter went to MSC and Maersk. Additionally, a new carrier has emerged in the form of SM Lines. Hanjin’s demise may also have catalyzed the creation of Korea Shipping by the government with $5.5 billion of finance. That has already led Hyundai Merchant Marine to discuss new capacity investments.
Source: Panjiva
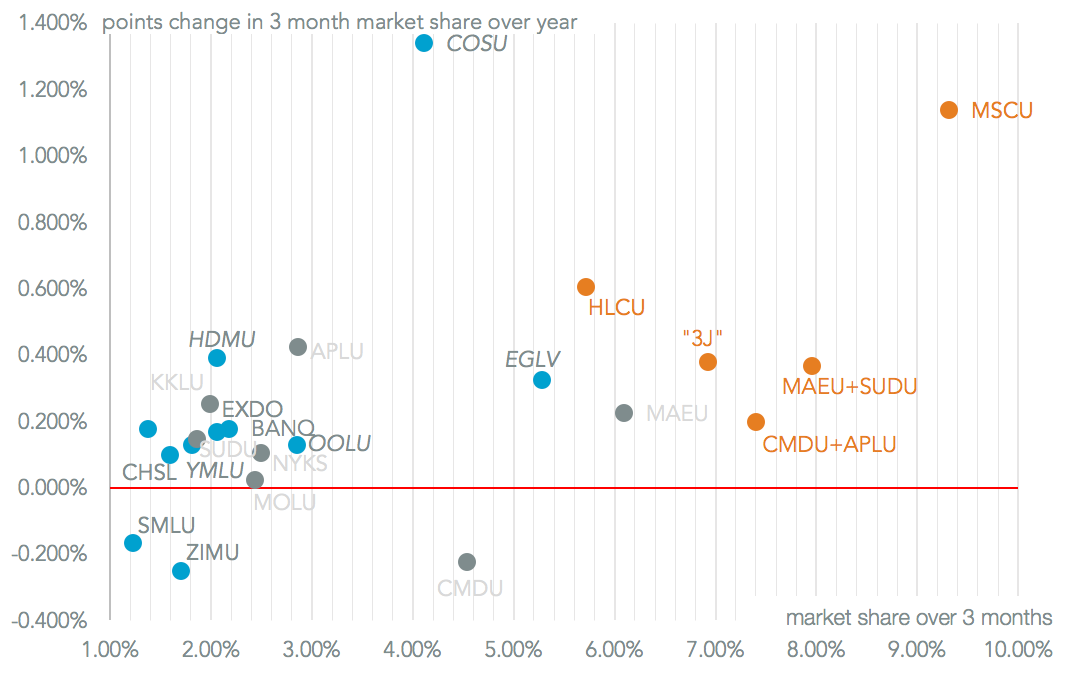
#3 Will the Box Club be clubbed by DoJ? (Mar 22)
The U.S. Department of Justice has served subpoenas to 20 container-lines at a Box Club meeting, the WSJ reports. Specific allegations have not yet been made, but this follows previous investigations by the EU and South Africa into price setting and communication. The DoJ had previously flagged its concerns about shipping alliances to the Federal Maritime Commission, who nonetheless approved them to start operations in April.
Container shipping rates increased 38% to their recent peak in February from April 2016’s lows, but are now 10% below that level. That’s likely due to concerns, expressed by several management teams, about a new round of capacity building. The ‘post merger big 5’ shippers held the equivalent of a 37% market share of U.S.-inbound traffic in the three months to February, up 2.7% points on a year earlier on a like-for-like basis. Including their alliance partners takes the total to over 50%. Whether the DoJ investigates pricing or other matters, or not, this move may cast a pall over U.S. approval Maersk’s bid for Hamburg Sud and the Japanese “3J” merger.
Source: Panjiva
#4 Shipping consolidation marches on (April 6)
Container-liners had a bumper March for U.S.-bound shipping with an 8% jump in volumes on a year earlier. All but three (Mitsui-OSK, ZIM and Seaboard) of the top 20 shippers saw an expansion in shipments on a year earlier, Panjiva data shows. The fastest organic growth came from Evergreen, though there may be some volatility in the numbers due to alliance realignments ahead of the April 1 commencements of THE and Ocean.
Organic consolidation continued, with the top 20 shippers increasing their market share in the first quarter by 4.7% points on a year earlier to reach 63.1%. Some controversy exists around alliance operations after Congressional hearings and a DoJ investigation. Panjiva analysis of the top 750 shipper-country pairs shows the three alliances are evenly balanced outside south America on U.S.-bound routes, and face challenges from NVOCCs and non-aligned carriers.

Source: Panjiva
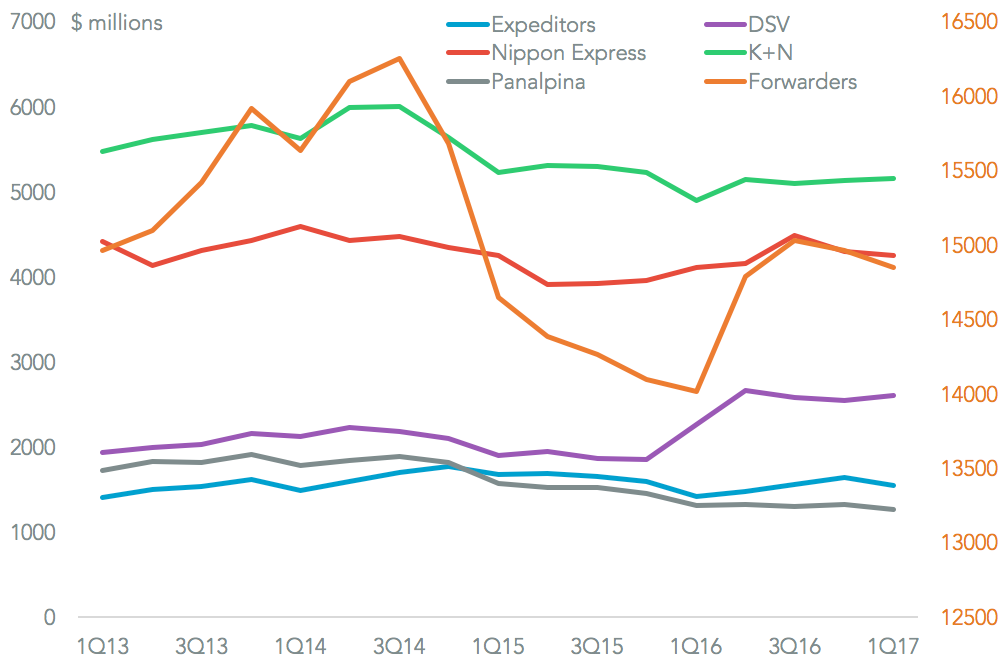
#5 Forwarders’ revenues fly (May 9)
Freight forwarder Nippon Express reported first quarter revenues that were 2% higher than a year earlier. They were 3% better than expected by analysts due to a strong performance from the logistics support division. The company forecasts 4% revenue growth for the coming financial year. The five freight forwarders together ( including DSV, Expeditors, K+N and Panalpina) saw 6% revenue growth for the quarter, and beat expectations by 2%. Despite their exposure to faster growing airfreight, their revenue expansion may still lag the 7% growth expected for the container-lines within the broader logistics industry.
Source: Panjiva
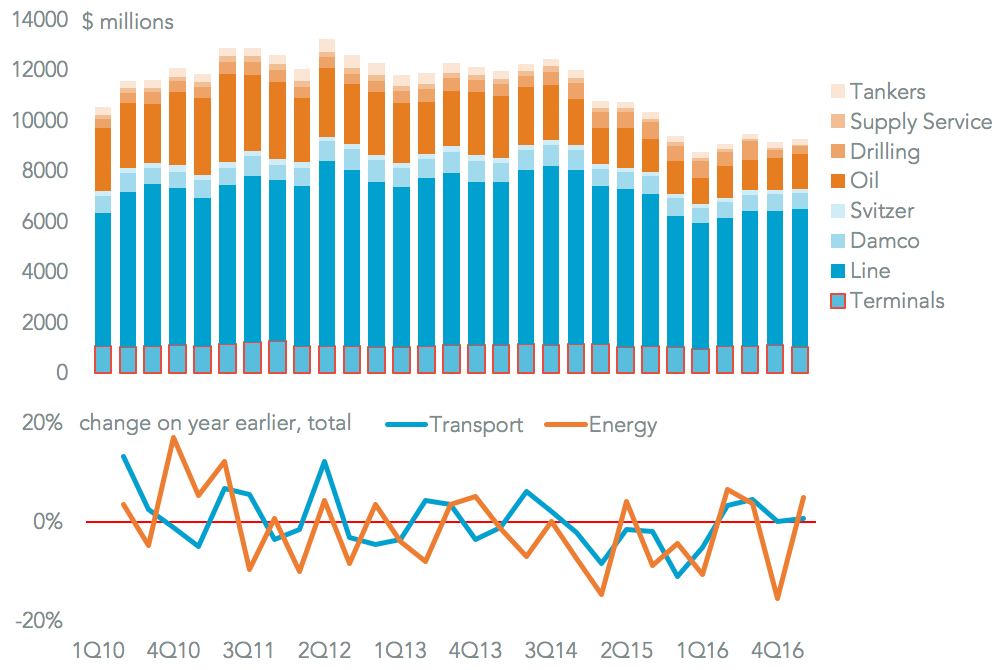
#6 Maersk’s cyber-security woes (June 20)
Container-line Maersk has suffered an IT outage due to the “Petya” virus. That has impacted upon its shipping units, but not energy. With vessels continuing to operate the main problem area is APM Terminals. The Port of New York has indicated its facility will be offline until June 29, while the company works on a recovery plan. APM operates 75 ports globally, handling 9.4 million TEUs in the first quarter of 2017. There may be a small impact on revenues for the second quarter – Panjiva analysis shows it accounted for 12% of Maersk group revenues in the past 12 months.
Source: Panjiva
#7 COSCO’s Orient odyssey (July 10)
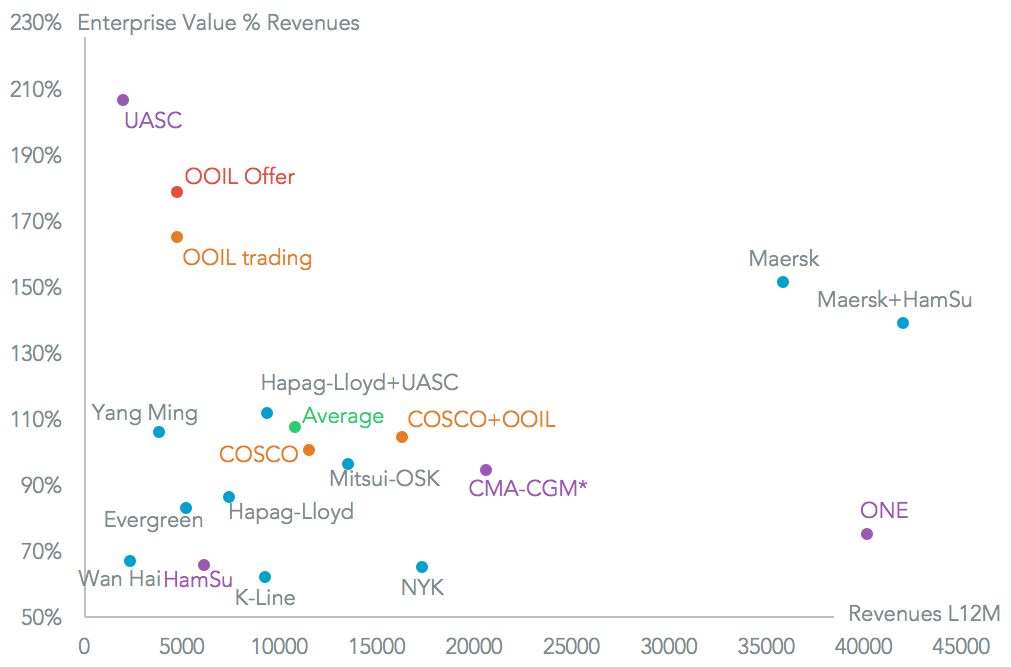
COSCO Shipping’s $6.3 billion bid for Orient Overseas will create the number three shipper globally. The resulting group will be just 6% smaller than MSC once its current build plans are complete. Regulatory approvals will be the biggest issue, with the deal being conditional on receiving U.S. and EU approval among others. U.S. approval may be a challenge, with Panjiva data showing the combined entity will become a top three operator on six U.S.-inbound routes including China. Strategically the group aims for “synergies” and growth.
On the former, it appears no cost cutting will be done for at least two years. Revenue growth from cross-selling may be challenging given the two have similar geographic sales mixes already. The bid price implies an enterprise value-to-revenue ratio of 179%. That is closer to Hapag-Lloyd’s bid for UASC (207%) than Yildirim’s proposed sale of CMA-CGM (94%). The deal will be fully debt-financed, bringing the combined group’s debt to $14.7 billion, or a debt-to-capital ratio of 60% from 41% currently.
Source: Panjiva
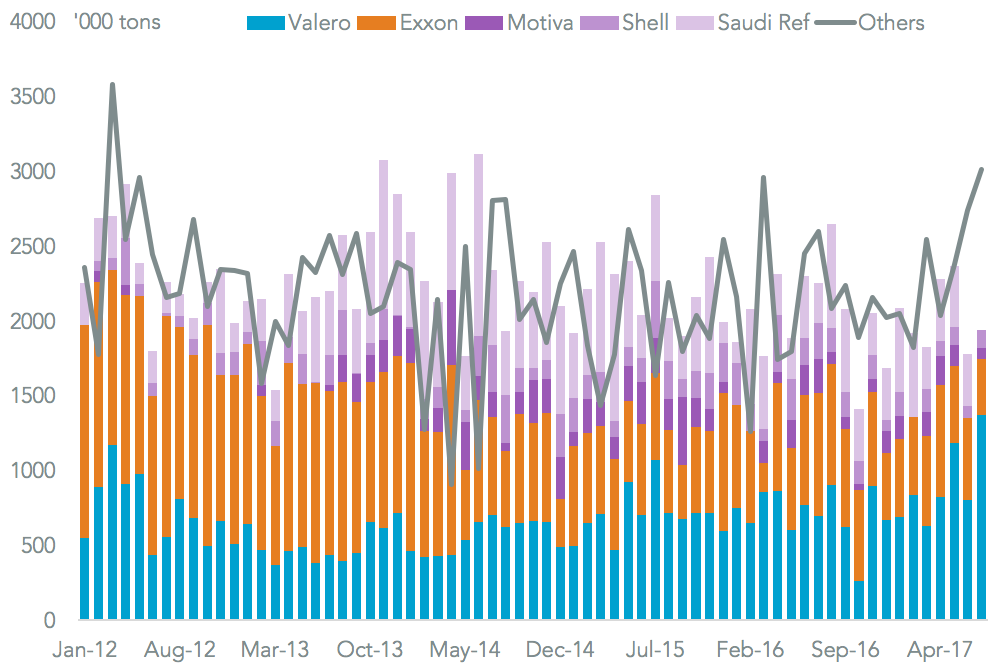
#8 Houston’s Harvey disruption (Aug 29)
Hurricane Harvey does not appear to have damaged port facilities at Corpus Christi and Houston, but both remain closed as rainfall and flooding conditions – which could persist – are assessed. Port Houston handles around 6,500 TEU of container freight per day, which will either be delayed or redirected – road and rail conditions have suffered too. Shipping disruption could spread to other ports as consignees including General Motors and handlers including Expeditors and Schneider look for other routes. The largest consignee for crude oil at Houston is Valero, while at Corpus Christi it is ExxonMobil.
Source: Panjiva
#9 Coping with Puerto Rico’s devastation (Sept 26)
Hurricane Maria has devastated Puerto Rico, with continued centralized power outages and logistics complicated by port closures. As at 9/26 seven of 13 ports have reopened, with three (including Crowley’s) operating on an unrestricted basis. Re-establishing supply chains will be complicated by disruptions in neighboring Dominican Republic (DR), which accounted for 16% of all seaborne shipments and 22% of containerized freight in the past year.
Analysis of over 2,000 product-country pairs shows critical supplies of bottled water (1,150 TEUs) and baked goods (1,010 TEUs) came from DR over the past 12 months. Importantly, in healthcare, DR supplied 2,610 TEUs of medical equipment and shipped 1,400 TEUs of pharmaceuticals. Leading importers in healthcare include Edwards Lifesciences, Fenwal and Baxter Healthcare. Significant supplies from outside the DR include plastics from Colombia, plyboard from Brazil and glassware from Peru.

Source: Panjiva
#10 Panalpina’s deal hunger, ready for “major takeovers” (Oct 4)
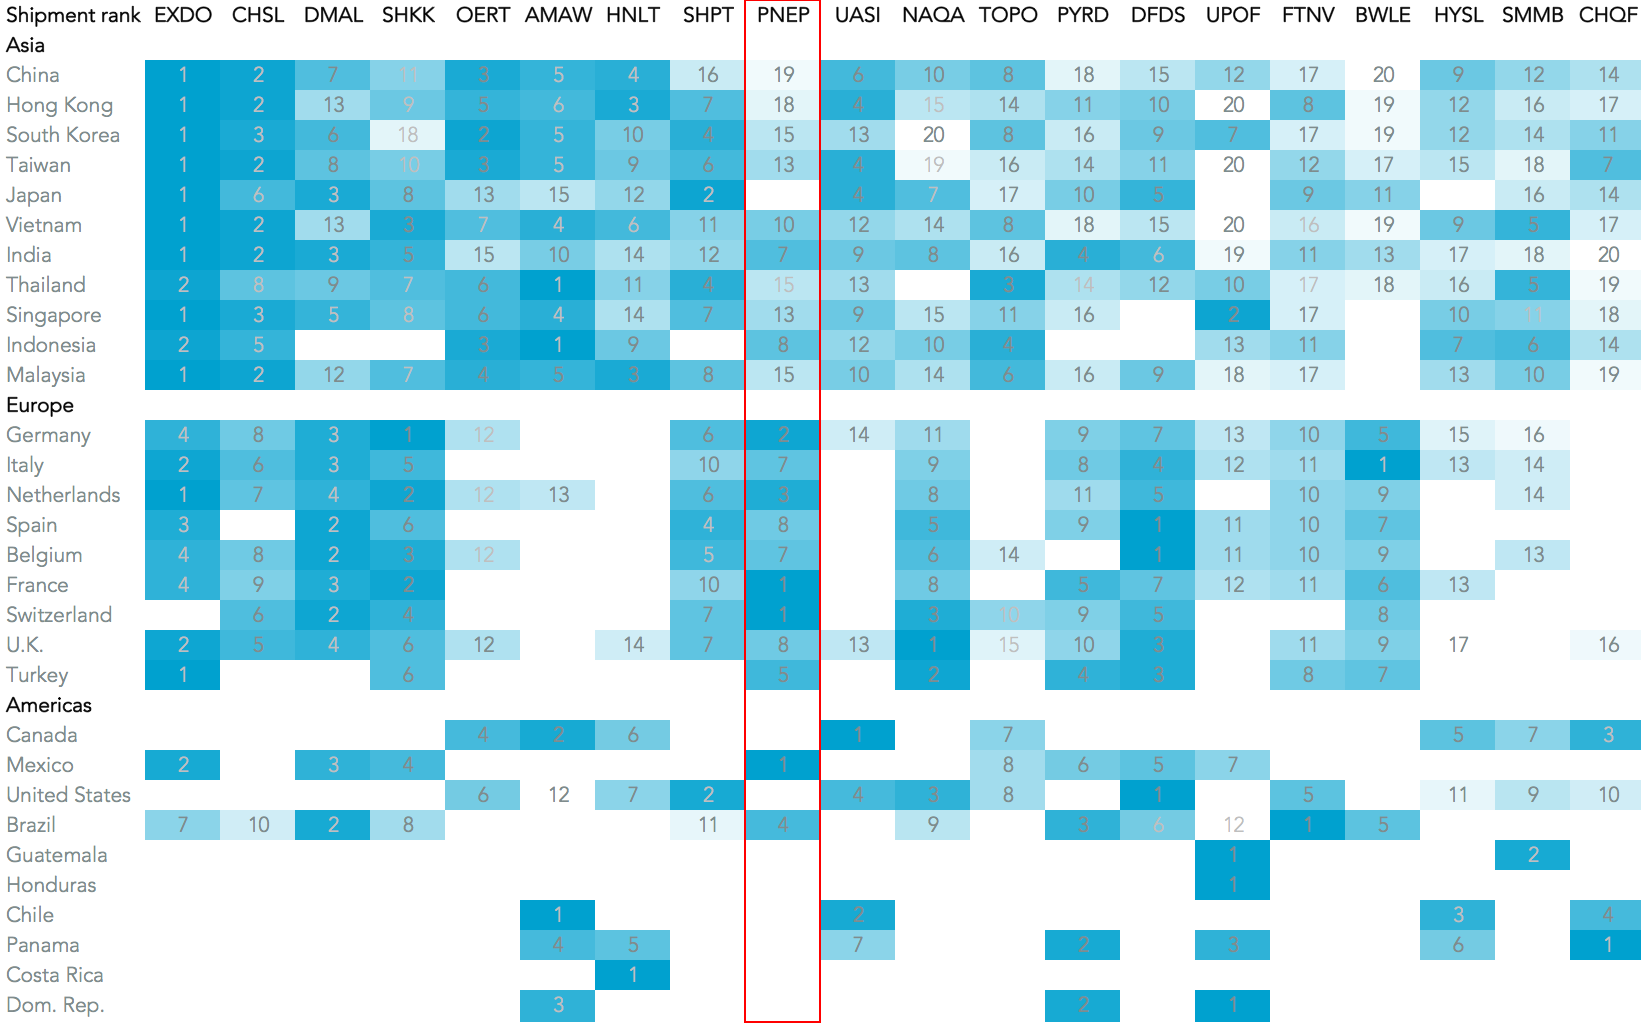
Panalpina’s Chairman, Peter Ulber, has stated the company is ready for “major takeovers” across its business lines. It’s not the first time a freight-forwarder has cited the need for consolidation recently, with DSV making similar comments in early August. Panalpina’s move would come shortly after disappointing results. In the second quarter its revenue growth of 4% lagged peer K+N’s 8% and the sector average of 5%.
It has also fallen behind in more specific areas such as U.S. seaborne shipments, where its volumes dropped 4% vs. an average 5% increase. Panjiva analysis of over 2,300 company-country combinations in U.S. inbound traffic shows a tie-up with an Asian shipper – particularly on China-outbound routes – could make most sense. The issue is that major NVOCCs including Apex Shipping, Orient Express and Honour Lane have major shareholders who may not be willing sellers.
Source: Panjiva
#11 UPS beats Expeditors, at a cost (Nov 9)
Freight forwarders operating on U.S.-inbound, seaborne routes had another month of growth in October, with a 4% rise in shipments driven by strong exports from Asia. UPS did best of the top 10 operators, with a 27% rise in volumes on a year earlier. That allowed it to take market share from Expeditors (which only expanded 2%) and Deutsche-Post DHL (down 3%).
Yet, UPS volume gains may have come at a price – Expeditors maintained best-in-class profit margins in the third quarter after shedding market share in favor of better achieved rates. The top three ranking didn’t change. UPS is still a long way behind Expeditors and CH Robinson , though it was DB-Schenker’s rise that has been notable. It reached fourth by volume, displacing DP-DHL. Continued competition raises the prospect of further consolidation, though it has been NYK rather than Panalpina or DSV that has led the way.

Source: Panjiva
#12 Maersk leaves ineffective TSA (Dec 14)
Maersk will reportedly complete its plan to leave the Transpacific Stabilization Agreement (TSA). The TSA, as the name suggests, has sought to maintain stability in rates. It has come under pressure from the U.S. FMC which wants carriers to either be in an alliance (Maersk is in 2M) or a TSA-type arrangement but not both. All but one of the TSA members are in an alliance already.
In any event the TSA has been relatively ineffective, with China-to-U.S. west coast rates having fallen 21% year-to-date vs. 6% for all China outbound routes. It is also a more volatile route, averaging a 2.1% weekly change this year vs. 1.3% for Japan and 1.5% for Europe-bound routes. The remaining members of TSA hold a 39% share of major Asia-to-U.S. west coast routes after Maersk’s 5% has been removed, though it does still include seven of the top 10 shippers.

Source: Panjiva