 En
EnThe Republican Party’s sweep of the Congress and the presidency make it likely that the trade policies outlined by President-Elect Trump in his “ Contract with America” will be implemented. These policies are broadly protectionist and are likely to add friction to trade relations in the coming 12 months.
There are four major policy areas to be considered. The most significant short term is a renegotiation of NAFTA, which the president can trigger using article 2205. The 14% collapse in the Mexican peso since polls closed suggests the market expects a significant rework. One of the largest impacts may be on the autos industry, which has cross border supply chains reliant on the free movement of goods.
Existing plans from Ford and General Motors to expand may be revisited in light of taxes that could amount to $4,700 per vehicle if a 35% tax is implemented, as discussed in Panjiva research of September 15. It would seem unlikely that such a tax would only be implemented for U.S.-domiciled companies. Non-U.S. manufacturers accounted for 79.4% of Mexico-to-U.S. exports of completed autos, Panjiva data shows.
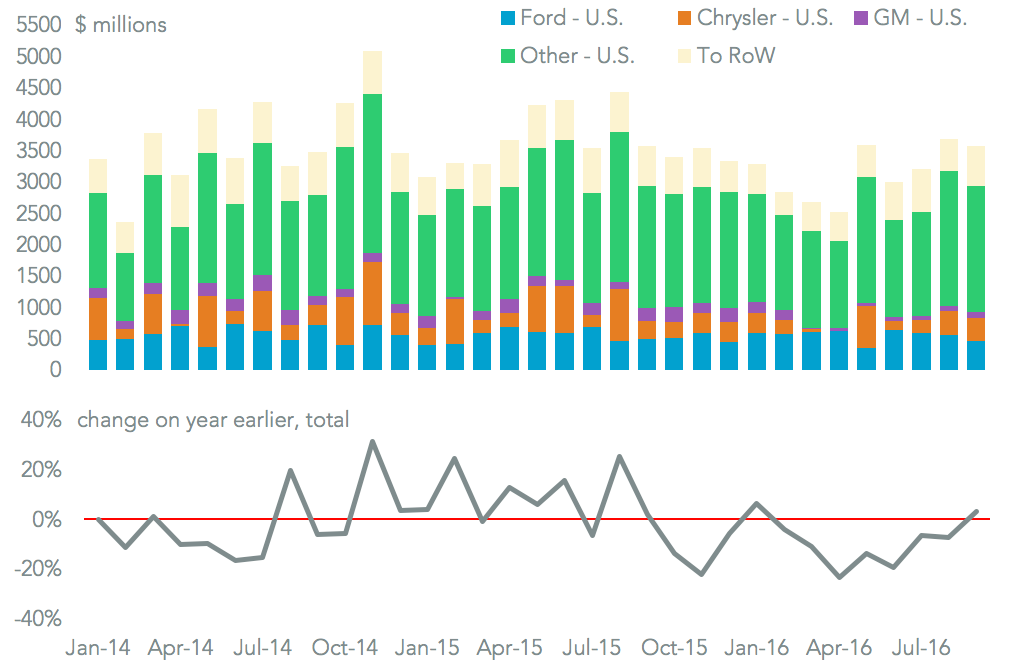
Source: Panjiva
Both parties had already committed to either reviewing or not implementing the Trans-Pacific Partnership trade deal with Japan and ten other countries. While a ‘lame duck’ passage in the U.S. is possible, it would in any event require changes – for example on biologic drug rules – that the TPP partners would want to review.
U.S. trade with TPP partners had been trending down over the past year. As of August the sum of exports and imports on a rolling 12 month basis was 2.4% lower than a year earlier at $404 billion, Panjiva data shows. August saw growth of 1.0%, including a 1.7% increase in trade with non-NAFTA TPP members and 0.7% with NAFTA members.
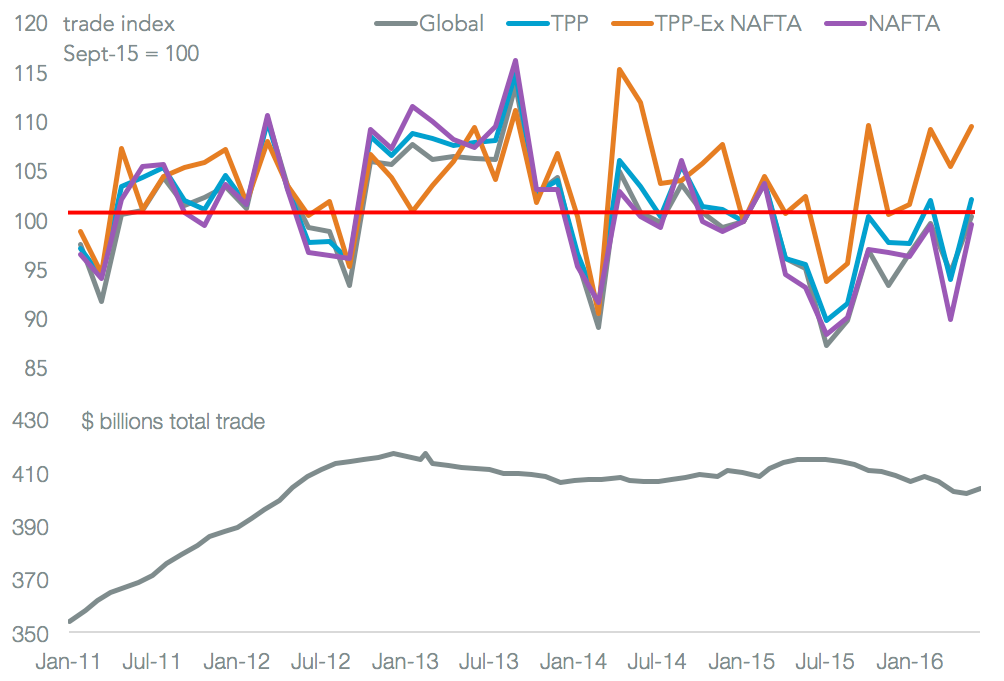
Source: Panjiva
Another plan is to formally label China as a “currency manipulator” and apply taxes on imports of up to 45%. The currency issue may have implications for China’s accession to “ Market Economy Status” at the WTO. The taxes may be more specific in application – it would seem more likely that they would generate inflation rather than jobs in the U.S. This may also increase China’s urgency to bolster trade deals including the Regional Comprehensive Economic Partnership and the Shanghai Cooperation Organization.
U.S. imports from China have actually fallen in 11 of the past 12 months, including by 8.1% in September, while exports to China increased 1.4% in September according to Census Bureau data. This comes despite the yuan being 5% weaker than a year earlier.

Source: Panjiva
Ultimately these are just broad brush policies, and focussed more on the import side of the trade deficit than exports – though goods imports may have jumped in October, based on Panjiva data for seaborne imports. Furthermore the focus has been on goods, not services which are a significant driver of the U.S. trade balance. Services accounted for 35% of the reduction of the deficit in September.
Administratively the devil will be in the details. Question areas include: how will the new ‘America Desk’ work in terms of trade policy formulation and execution; who the trade negotiators will be; how involved will the president get in detailed policy and negotiations; and what will be the reaction of the Congress when new policies come for discussion.

Source: Panjiva


