 En
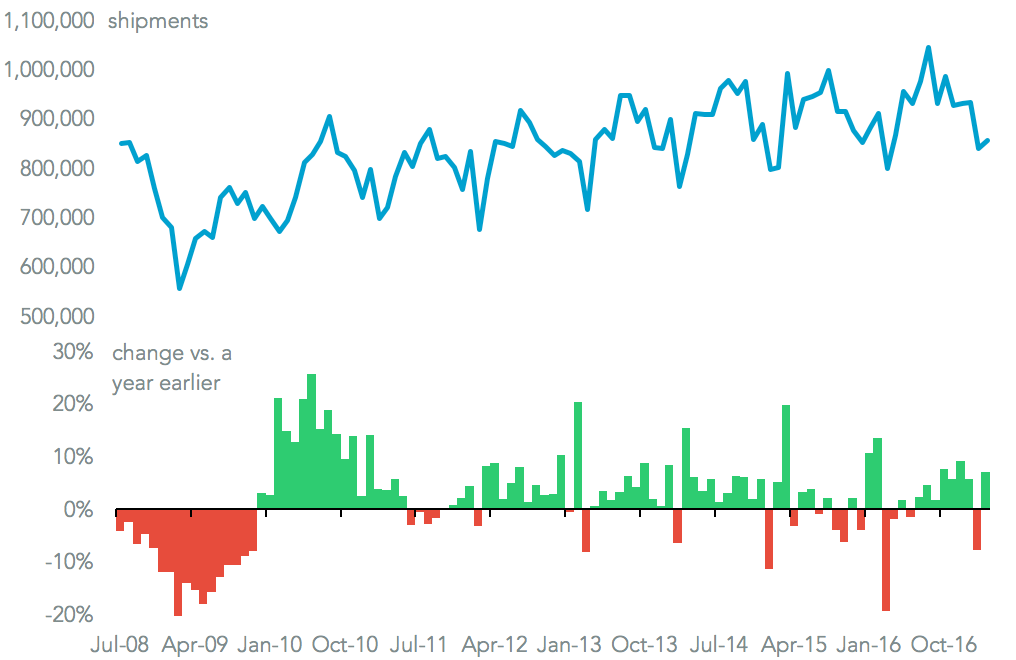
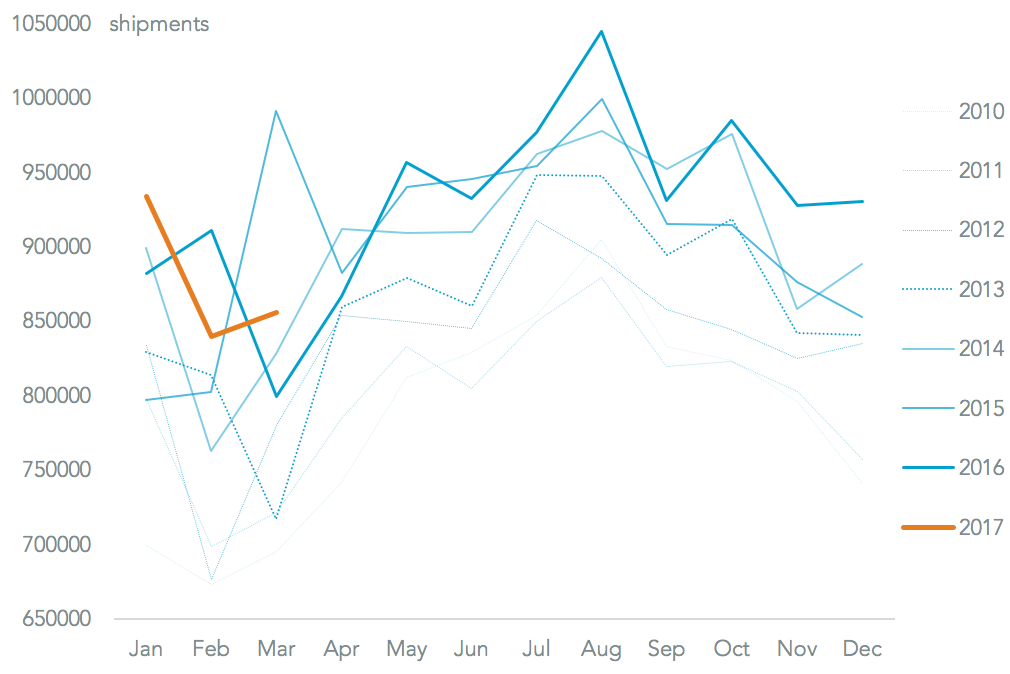
EnU.S. import growth returned with a bang in March, with seaborne shipments rising 7.0% on a year earlier, Panjiva data shows. Despite a weak February result for imports, as discussed in Panjiva research of March 28, this meant the first quarter experienced a 1.4% rise in shipments. The March growth was the fastest since December’s 9.1% increase, though it was 13.7% below 2015’s level which included the aftermath of the west coast shipping strikes.
Source: Panjiva
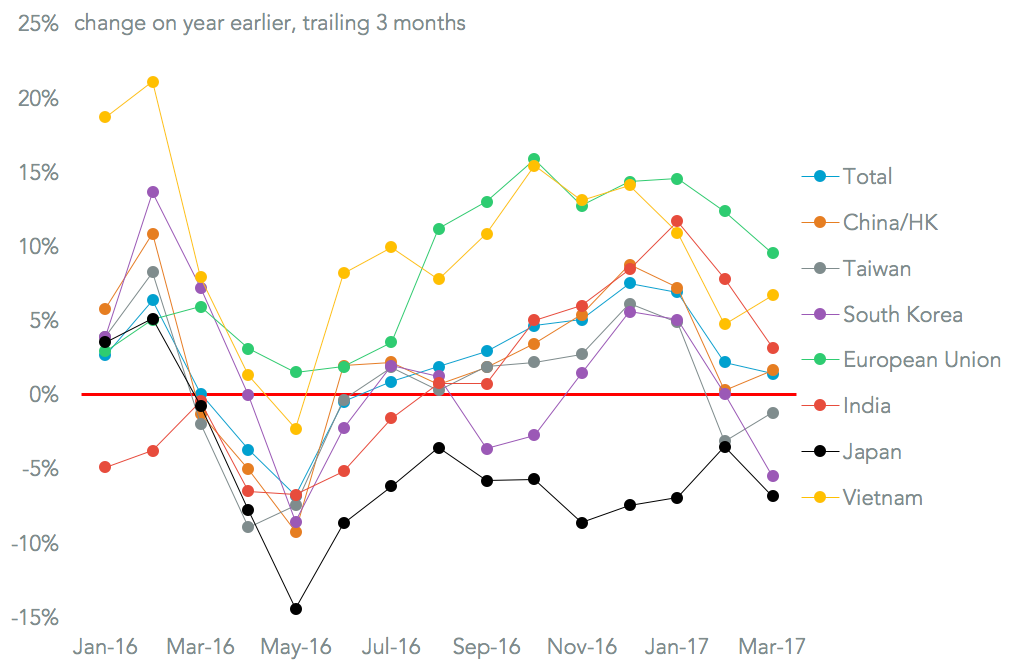
On a geographic-basis the biggest contributor to growth was a 20.9% increase in imports from China and Hong Kong. That return to growth, following a reduced deficit the month before, may add some friction to any follow-up talks after Presidents Xi and Trump met on April 6/7. The growth rate was the fastest since the 2015 shipping disruptions.
Shipments from Vietnam, which is increasingly a production hub for industries ranging from renewables to telecoms, increased 22.2%. The main loser was South Korea, which saw a second month of declines with 10.6% fewer shipments. That contrasts with its strong global export performance.
Source: Panjiva
One item that will be particularly unwelcome to the Trump administration will be the rise in imports of autos and components. These increased 9.6% in shipment terms, the eighth straight month of growth and the fastest undisrupted rate since October 2014. Iron and steel imports also rallied, rising nearly 25.3%. That may cause the Commerce Department to take another look at the industry. Among consumer goods furnishings returned to growth, with a 19.8% rise while apparel extended its losing streak to a tenth month.

Source: Panjiva
The import acceleration may be following fundamentals rather than concerns (or otherwise) about trade policy action. Consumer confidence in the U.S. hit its highest since December 2000 in March according to CNBC, while business import expectations remained in positive (if slowing) territory. In the previous six years around 23.0% of full year imports had been completed. On the basis of progress so far this year that would suggest imports for the year could rise 2.6% on a year earlier, though it is very early to be making a firm prediction.
Source: Panjiva


