En
EnThe recovery in trade activity in the wake of COVID-19’s closures of the industrial and retail economy continued apace in September. Panjiva’s U.S. seaborne import data shows that total shipments climbed by 14.8% year over year in September, following a 13.1% improvement in August. Imports of containerized freight similarly increased by 11.1% in September after an 6.0% rise a month earlier.
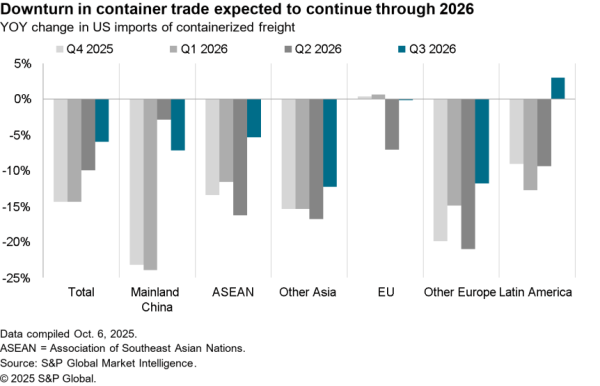
There’s also some evidence of the peak shipping season being pulled forward with containerized freight imports having increased by 0.1% sequentially when normally – based on the past 10 years – shipments in September are 4.9% lower than in August. Whether that’s due to expectations of an earlier peak-shopping season or conservatism against the risk of a resurgence in the pandemic isn’t immediately apparent.

Source: Panjiva
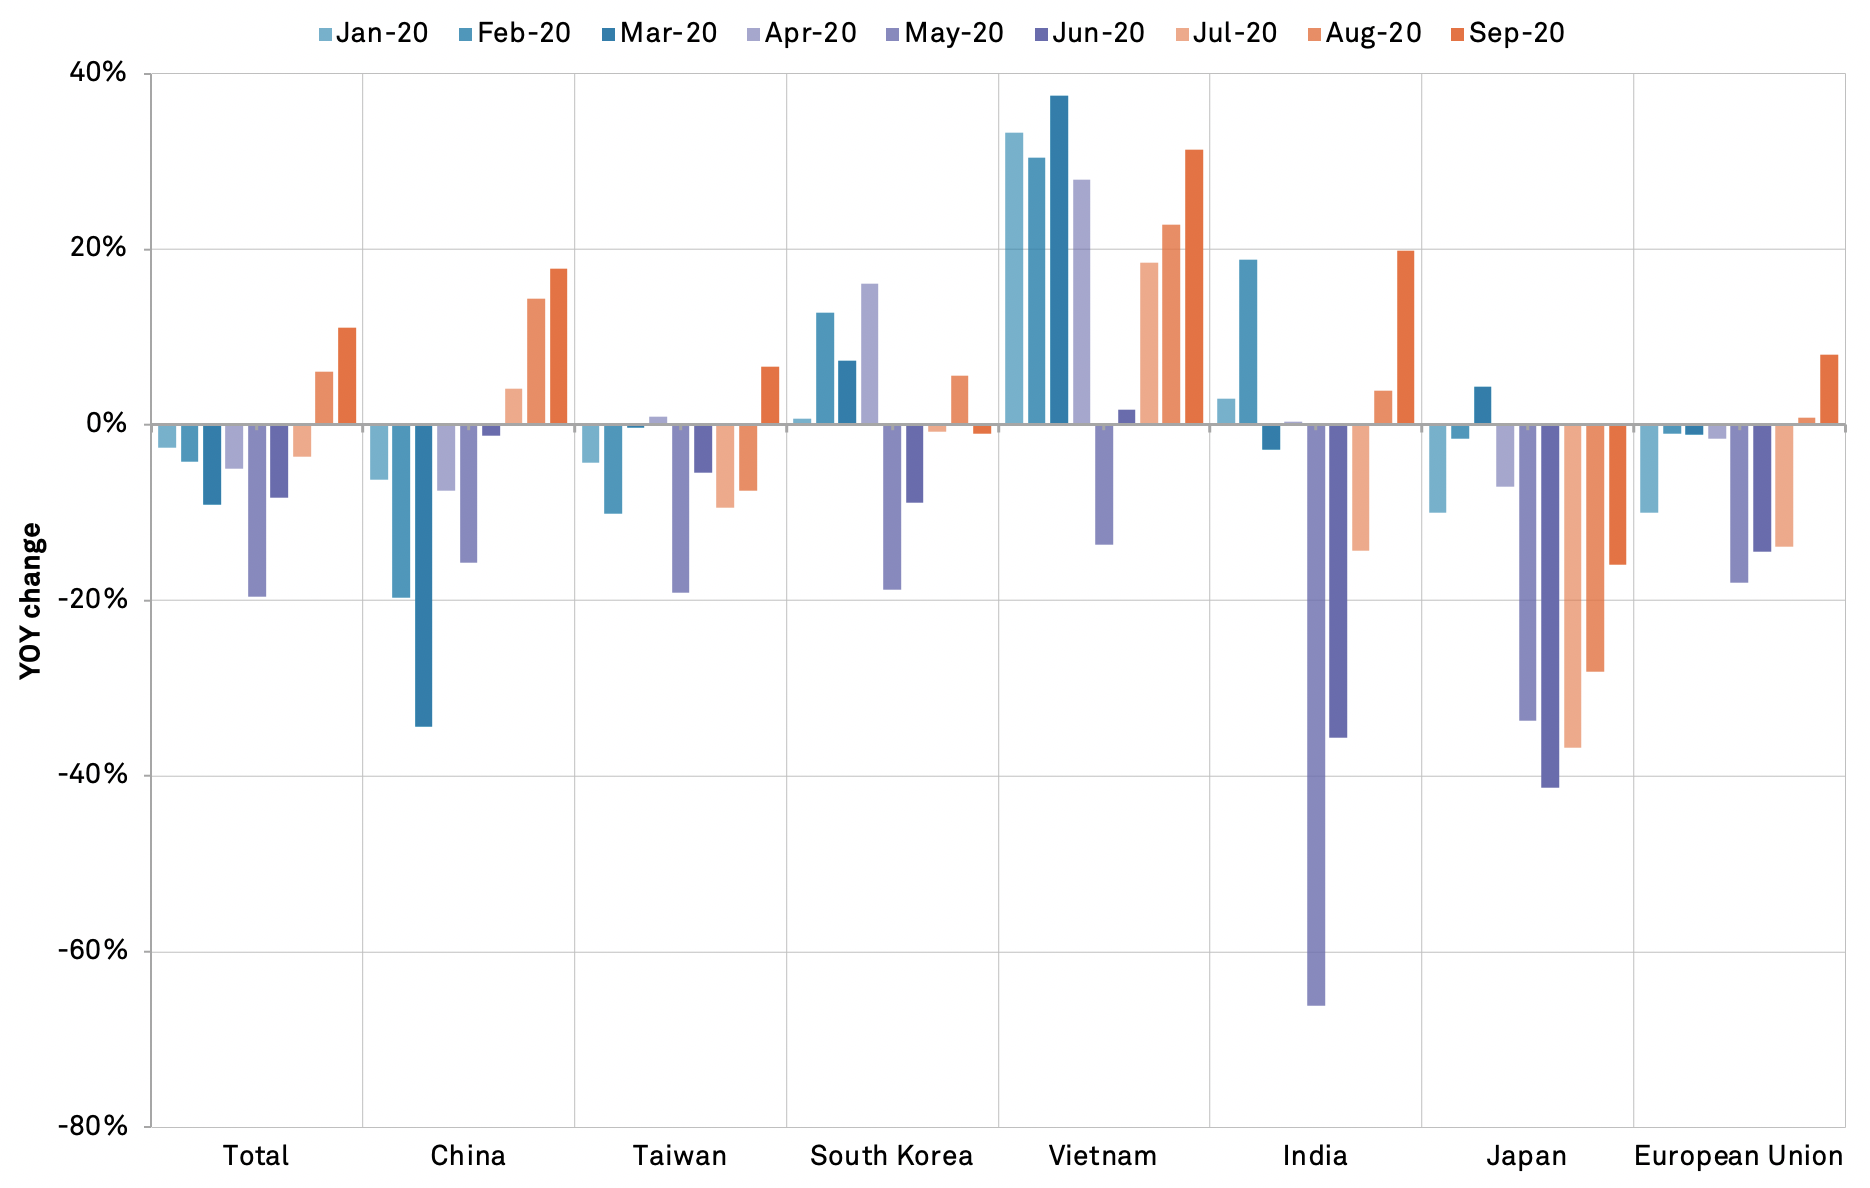
As has been the case in prior months it was shipments from China that led the way with a 17.7% year over year surge marking an acceleration from a 14.4% rise the month before. Aside from the earlier economic recovery that may reflect shippers wanting to get ahead of the risk of a post-Golden Week resurgence in the pandemic. Additionally with tariffs now over two years old, as discussed in Panjiva’s Oct. 8 report, it’s likely that many supply chains have either adapted or factored them into costs.
Shipments from Asia ex-China accelerated to a 13.5% increase compared to 4.2% a month earlier. A continued downturn in exports from Japan and South Korea – both dominated by the troubled automotive sector – was offset by a 31.3% jump in shipments from Vietnam. A widely trailed, and not implemented, section 301 review of Vietnamese exports may have triggered a similar pre-tariff rush to that seen in shipments from China two years ago.
Source: Panjiva
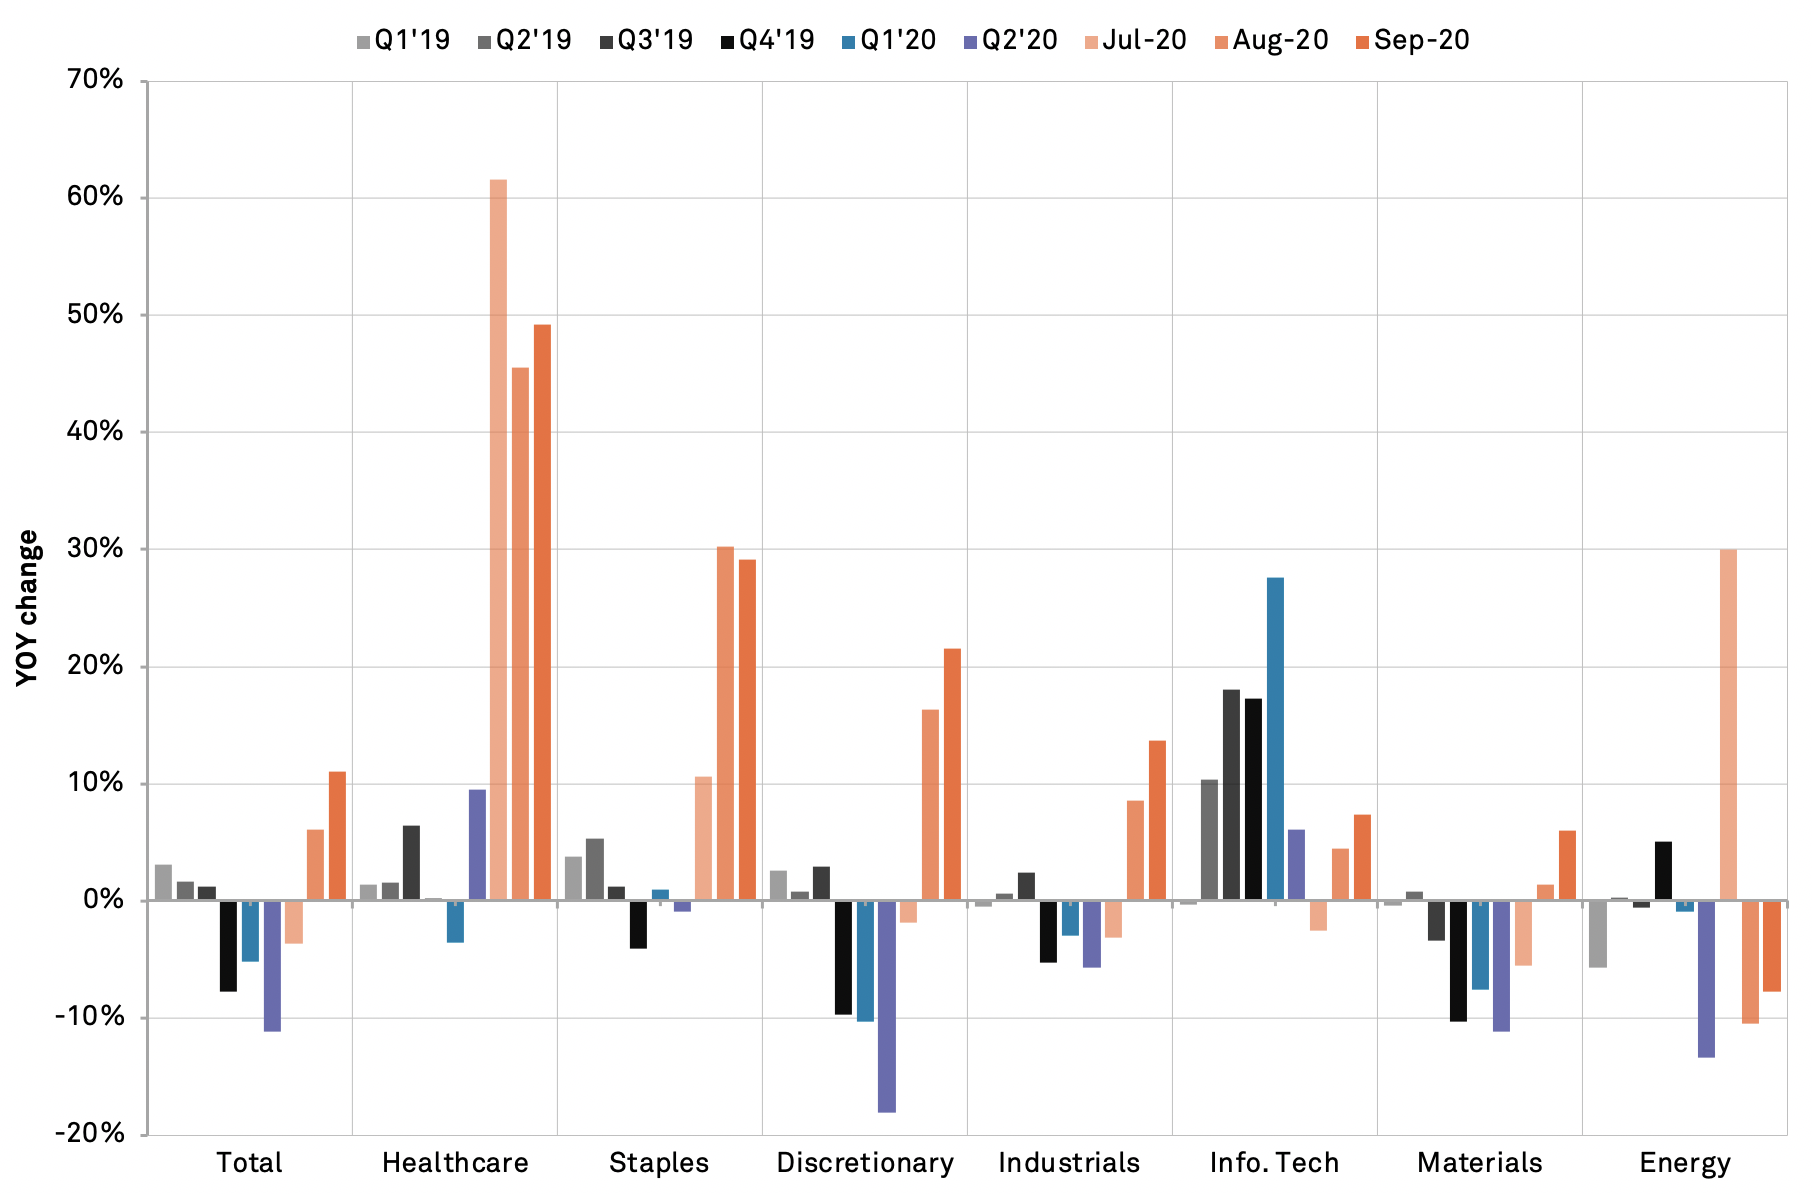
Only one of the GICS sectors analyzed, energy, suffered a year over year decline in September while only seven of the 27 sub-industries covered experienced a drop indicating the widespread nature of the recovery in both the industrial and consumer segments of the economy.
Unsurprisingly given the continued presence of the COVID-19 pandemic the fastest rate of growth was seen in the healthcare and consumer staples (which includes home and personal care) sectors with increases of 49.2% and 29.1% being similar to a month earlier.
Shipments in the consumer discretionary sector climbed 21.6%, marking an acceleration from August’s 16.4% increase and providing some credence to the hypothesis that retailers are seeking to get ahead of an earlier shopping season and the risk of further store closures.
Industrial imports also climbed 13.7% higher led by a continued surge in agricultural machinery imports as well as a recovery in industrial machinery. The latter is an encouraging sign of improved business confidence.
At the commodity end of the economy imports of materials increased by a more modest 6.4% though shipments of metals jumped 10.0% higher, confirming that the basis effect of tariffs has likely passed. Energy was the only industry to see a downturn, perhaps reflecting continued reduced demand from the transportation sector as well as earlier storm interruptions to supplies into the gulf coast.
Source: Panjiva