Panjiva’s Research team are the proud owners of shiny new e-bikes after a protracted order process that saw deliveries planned for last fall only arrived in the past few days. Global demand for bicycles has been elevated during the pandemic as the result of demand for fitness products, leisure pursuits and more recently for commuting without using public transportation.
Panjiva’s data shows that U.S. imports of regular and e-bikes climbed 53.5% in the three months to Feb. 28 compared to a year earlier and 68.2% compared to the same period of 2019. Imports of e-bikes surged 60.4% higher year over year while shipments of regular (push) bikes increased by 48.7%.

Source: Panjiva
Both have benefited from the more widespread spending on leisure goods, with total U.S. seaborne imports of fitness and other leisure goods having climbed 168.3% year over year in March, as outlined in Panjiva’s research of April 12.
U.S. seaborne imports of electric and non-electric bikes have continued to accelerate, with imports by 237% year over year in March and by 115% in Q1’21 compared to a year earlier. Part of that growth is due to the high proportion of imports from China and the associated closure of factories early in the pandemic in 2020. Imports in Q1’21 were nonetheless 86% higher than the same period of 2019.
Cycle manufacturers have had to contend with elevated freight costs and manufacturing capacity that has lagged behind demand. The surge in imports in Q1’21 would suggest the capacity issue at least has been addressed.
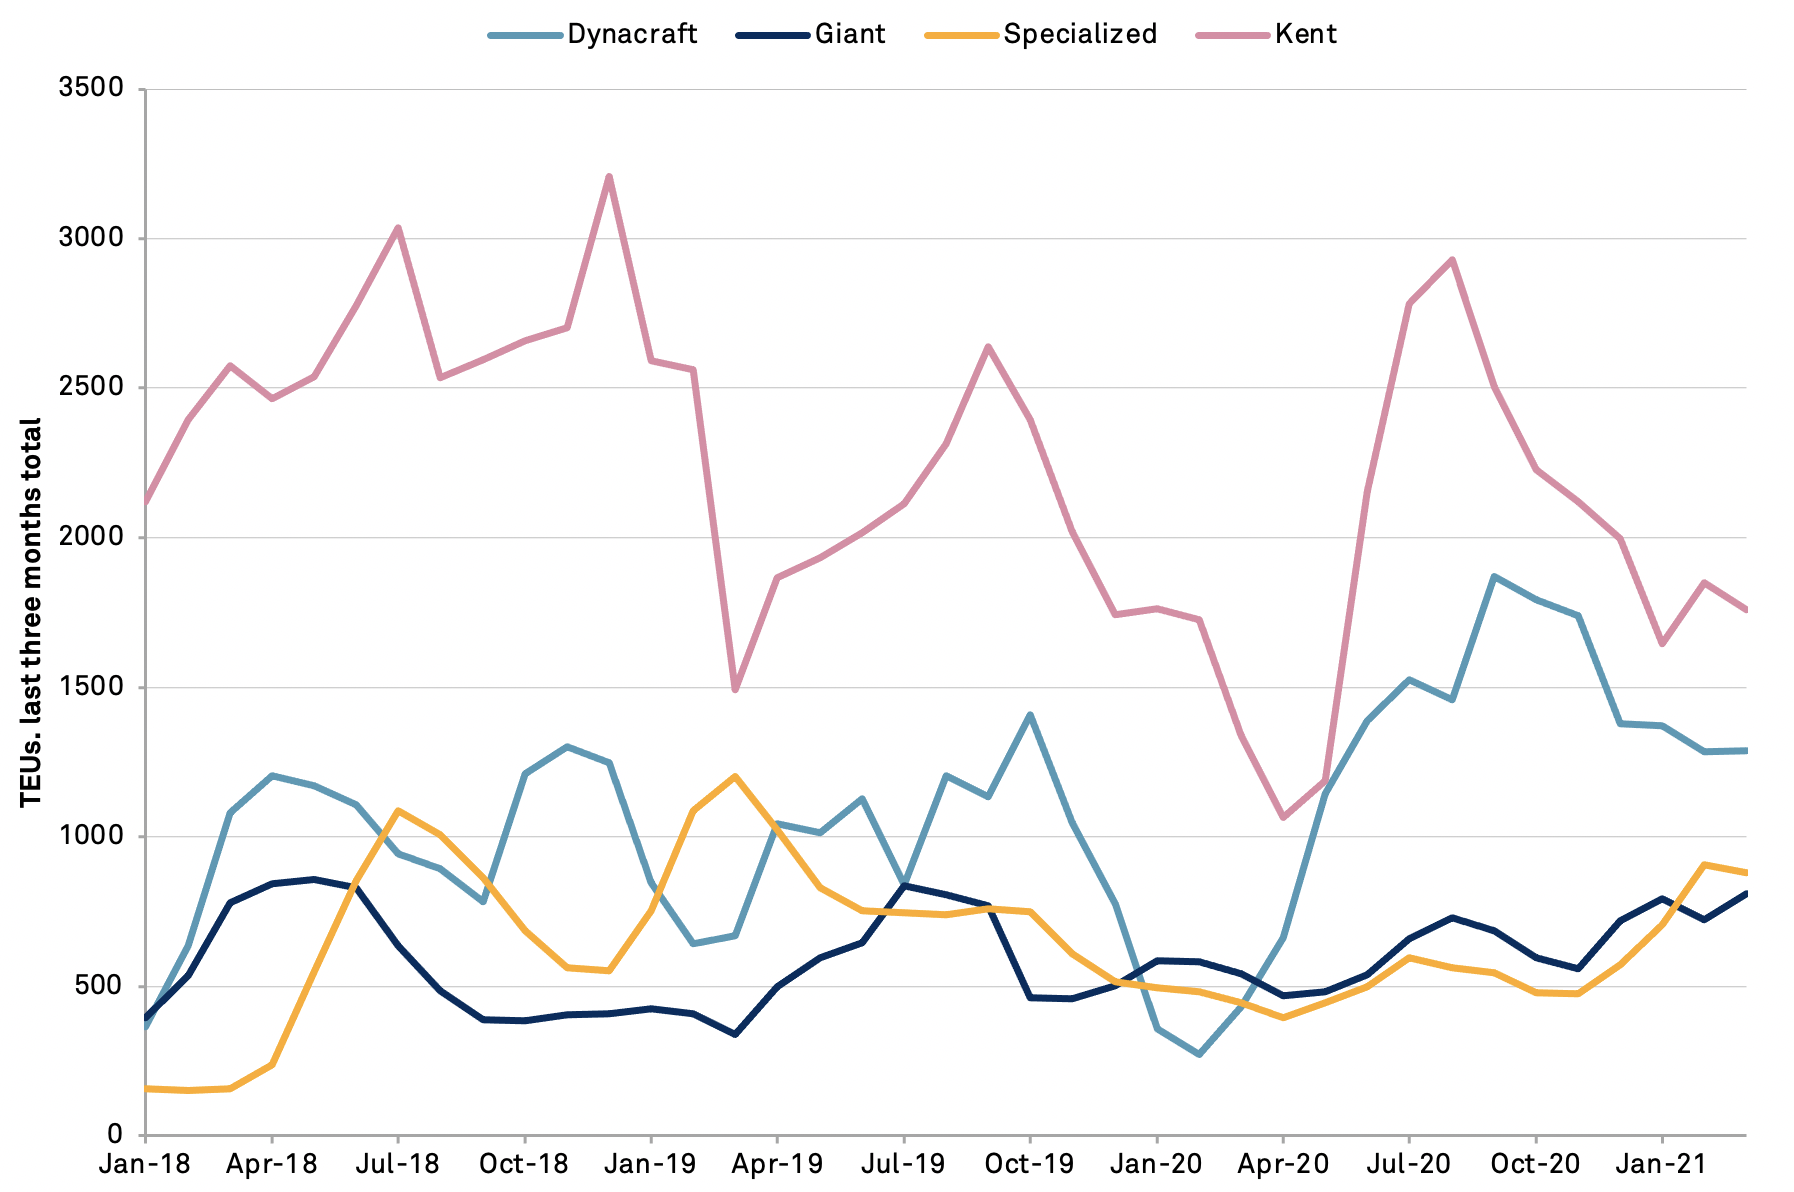
The growth in imports in Q1’21 was led by a 199.2% year over year increase in imports linked to Dynacraft, a specialist in kids products, which were also 93.0% higher than a year earlier.
Shipments by Giant and Specialized, which include premium racing brands, increased by 49.7% and 97.3% respectively though Specialized’s imports were 26.8% lower than the same period of 2019. That may reflect reduced demand for sports models given the absence of mass group cycling and triathlon events during the pandemic.
Imports linked to Kent International meanwhile increased by a more modest 31.6% and were led by components for the firm’s U.S. assembly facilities.

Source: Panjiva


