 En
EnThe U.S. Commerce Department has published the recommendations of its section 232 review of the steel and aluminum industries that were sent to President Trump in January. As outlined in Panjiva research of January 2 the two reviews are part of a package of trade measures that President Trump can act upon ahead of the midterm elections. The prior decision – a section 201 review of solar panels and washing machines – were both narrower in scope and more targeted in terms of products. This research report provides a short guide to the two reviews.
What is a section 232 review, and why has it been launched?
Section 232 reviews, part of the 1962 Trade Expansion Act of 1962, are designed to allow the Commerce Department to recommend to the President whether a set of imports are damaging to America’s national security. Both the concept of coverage and national security can be broadly defined. Importantly though it is in the specific purview of the President to decide what to do as a result of the review in terms of tariffs, quotas or other measures.
This particular set of reviews, into steel and aluminum, were launched in April 2017 and tie into the broader National Security Strategy outlined by the Trump administration in December. That brings together both economic and national security politics. Importantly President Trump’s economic policy is focused on employment. Panjiva analysis of official figures show employment in the steel and aluminum industries had been in a long-term decline after dropping to 1.83 million employees across primary and fabricated products, a 1.1% annual decline for 20 years. Yet, there had been a small recover (2.9%) in the past 12 months. One aim of the section 232 reviews is therefore to rebuild employment by blocking imports.
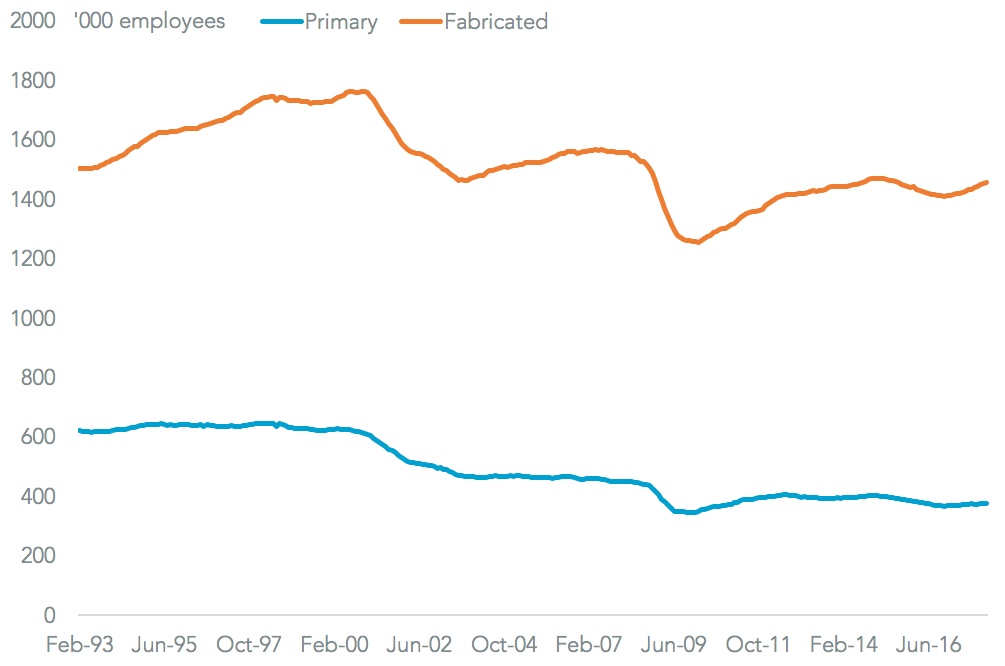
Source: Panjiva
So it’s just about jobs then?
No, the President’s “Make America Great Again” campaign is expressed in trade policy through a desire to cut the trade deficit. The administration’s economic standpoint is that the deficit represents other countries “taking” money from America and thereby cutting economic growth, even though the deficit is only an accounting convenience within the GDP calculation and actually represents a shortfall of savings vs. investment.
Nonetheless, the steel and aluminum industries (taking all products, and not just those under review) account for 5.1% of the U.S. trade in goods deficit, Panjiva data for imports and exports shows, the highest since at least 2009. It was also equivalent to $40.7 billion in 2017, the highest since at least 2009 as well and compares to $15.4 billion in 2010. Cutting imports of steel and aluminum, at least on the basis of those products alone and excluding the knock-on effect to other industries, makes sense from a trade policy perspective.
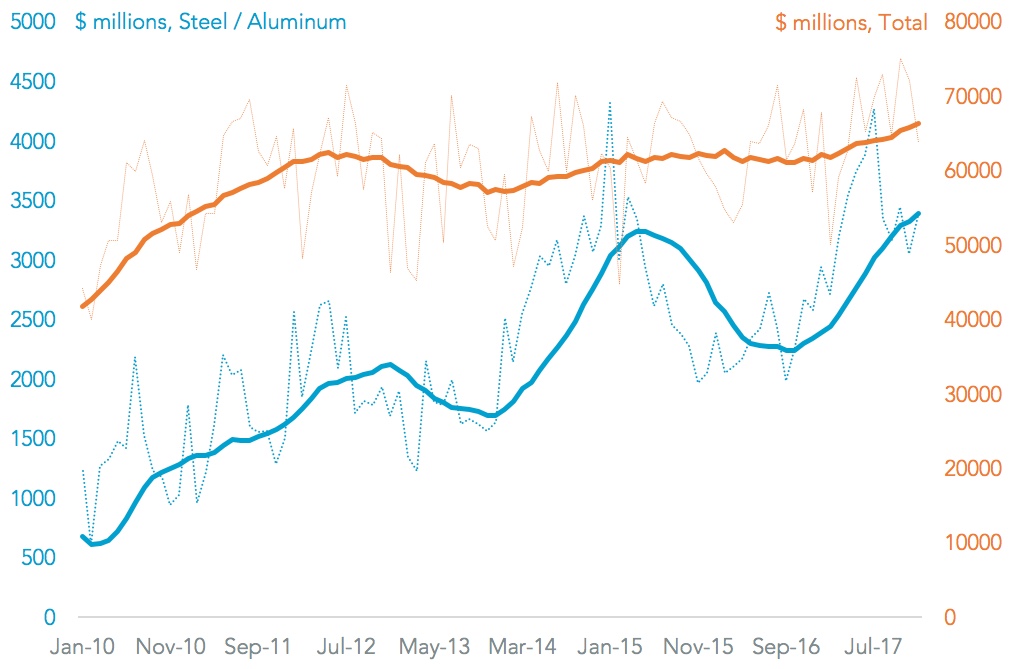
Source: Panjiva
Which metals have been targeted?
Broadly speaking all basic steel and aluminum types are part of the reviews rather than purely high technology items, the administration has defined five product categories for steel (four carbon/alloy and one stainless) and one for aluminum. The theory being that the broader economics of the metals industry need to be protected so that the companies involved can produce the defense-specific components. The largest categories are flat steel ($9.84 billion, or 21.3% of the total under consideration in both cases in 2017) and pipes/tubes ($7.41 billion or 16.1%) while aluminum altogether were $16.98 billion, or 36.9%.
The rate of growth in imports has accelerated in the past 12 months to 31.4% for steel (from 7.1% annually for the past five years) and 31.1% for aluminum (9.3%) which may reflect a degree of stockpiling by importers ahead of tariffs as well as rising commodity prices. Pipes and tubes grew the quickest in the past 12 months at 85.1%, followed by semi-finished products while long steel and stainless steels were the slowest at 7.2% and 22.5%.
That brought the overall total under the two cases to $41.1 billion, up 30.6% on a year earlier and 7.8% annually for the past eight years.
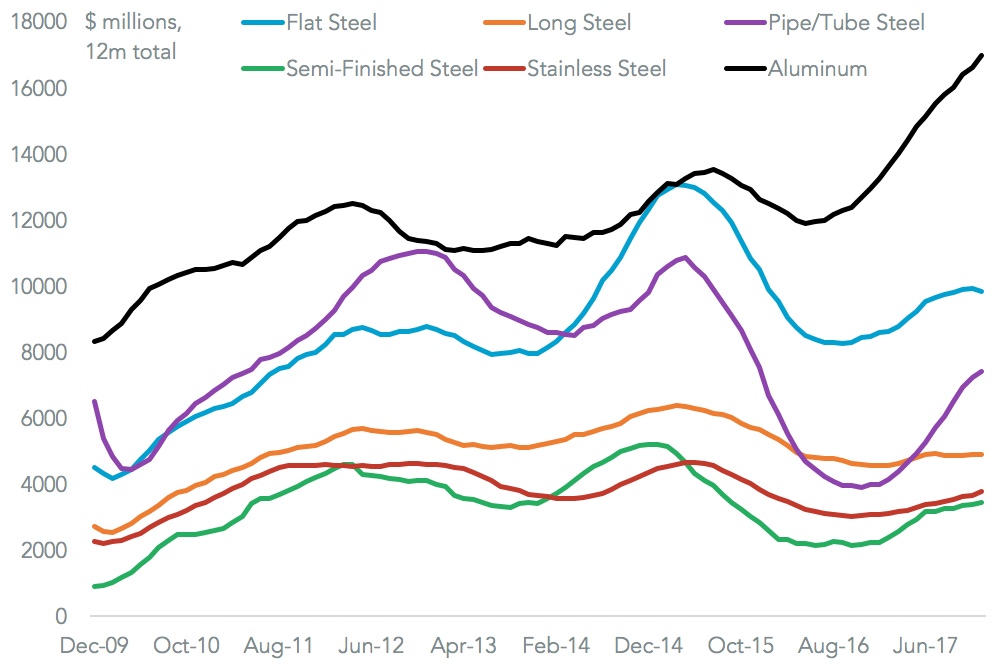
Source: Panjiva
What has been decided?
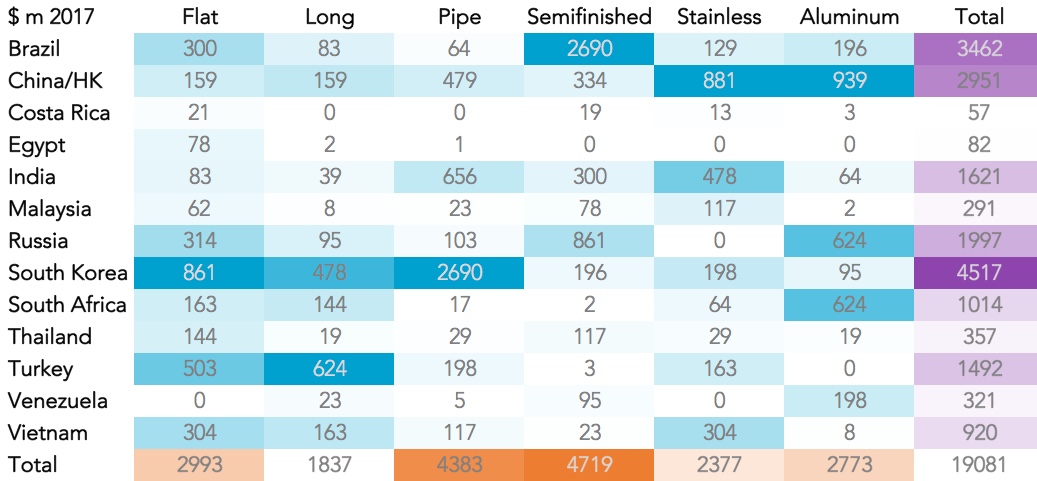
Nothing so far. What has been published are purely the advisory documents for the President. They have likely been published now to fill the gap between their initial submission to the President in January and the decision deadlines on April 11 and April 19 (for steel and aluminum). Commerce has given the President three options for each metal based around global quotas, global tariffs or a series of country specific tariffs/quotas. The latter includes 13 countries across the two reviews including China/Hong Kong, Russia and South Korea.
Taking the steel and aluminum products altogether, total imports reached $46.1 billion in 2017, 30.6% higher than in 2016 equivalent to growth of 7.8% annually for the past eight years. The most exposed countries to the review are Canada ($46.1 billion in 2017, or 26.2% of the total), Russia ($3.0 billion or 6.5%), South Korea (6.3%) and Mexico (6.0%) and China (5.9%).
Over the longer term the fastest growing exporters to the U.S. among the top 25 have been Vietnam (52.0% annually for the past eight years to reach $604 million, the UAE (38%), and Bahrain).

Source: Panjiva
What Is The Most Likely Outcome?
While the global restrictions have a broader range of coverage at $46.1 billion in total in 2017 vs. $19.1 billion for the country-specific recommendations, the headline tariffs are lower at 7.7% to 24.0% vs. 23.6% to over 53.0%. However, the country-specific recommendations may prove more defensible if challenged at the WTO. The section 201 reviews mentioned above are broad based and have drawn a series of complaints (or “ requests for consultation”) that may eventually result in a partial roll-back or countervailing duties. The country specific reviews may also meet the geopolitical aims of the administration with regards to China (and could tie into the section 301 review of intellectual property policies) and China.
The President in that regard could choose to be even more specific in his targeting. The largest products for China are aluminum ($939 million) and stainless steels ($881 million), while for Russia they are semi-finished steels ($861 million) and aluminum ($624 million). The largest products for South Korea, which may also trip up the KORUS trade negotiation are pipes/tubes ($2.69 billion) and flat steel ($861 million). What the President finally decides of course may come to include other factors that may emerge by April 11 and April 19 of course.
Source: Panjiva


