En
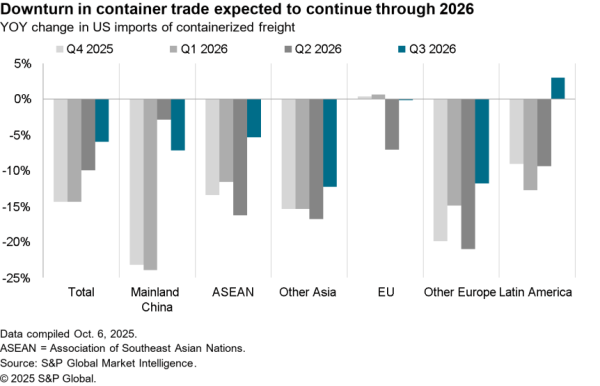
EnU.S. ports had another bumper month in May, with handling of containerized imports rising 5.4% on a year earlier, Panjiva data shows. While slower than the 8.9% expansion of a month earlier it represented the third month of growth and was the second highest level of handling since at least 2007. The expansion was driven by significantly higher imports from India and China, as outlined in Panjiva research of June 8, while shipments from the EU slowed.
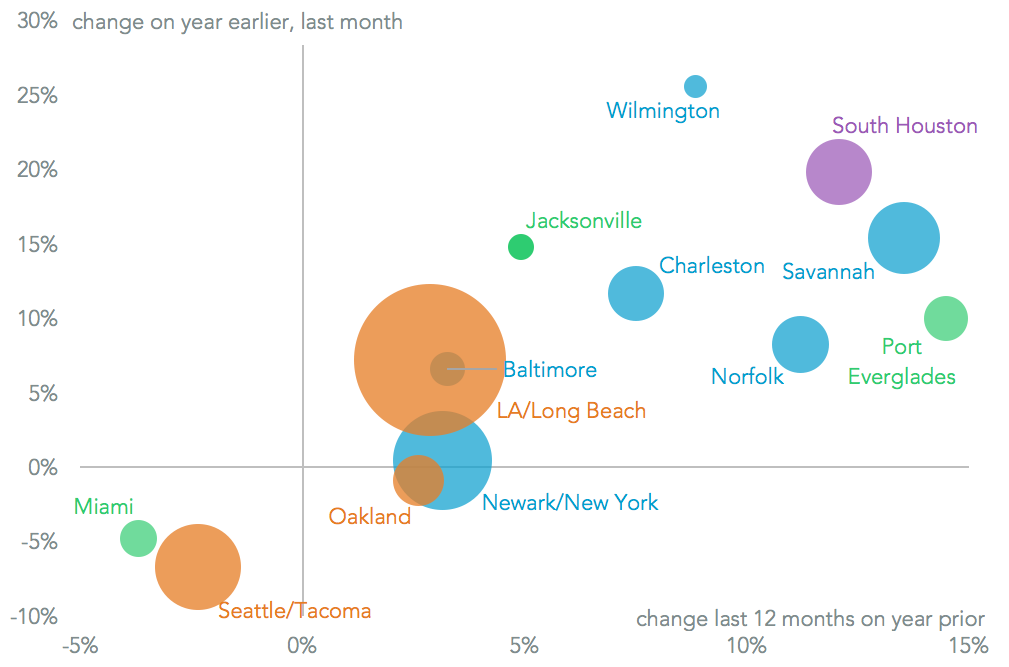
Overall the east coast ports continued to outperform those on the west coast, with most of the major port complexes except Seattle/Tacoma, Miami and Oakland expanding vs. the year prior. Wilmington (NC) was the fastest growing for the month at 25.6% while Port Everglades has shown the best sustained growth over the past 12 months on a year earlier at 14.5%.
Source: Panjiva
While the combined Los Angeles / Long Beach complex saw solid growth at 7.2%, there was a marked divergence in performance between the two. Handling specifically into Long Beach increased by 15.4%, while Los Angeles was broadly unchanged at 0.5% higher. That was driven by a surge in traffic from China (19.7% higher) and South Korea (increasing 35.9%), and means Long Beach likely set a new record. It would also suggest the restructuring in the port’s ownership following the collapse in Hanjin Shipping has been successful.
Another record-setter was Port Houston, which has saw a 19.9% growth on a year earlier. That has been the result of the addition of new Asian services – aided by the availability of the wider Panama Canal – and increased resin shipping.
Source: Panjiva
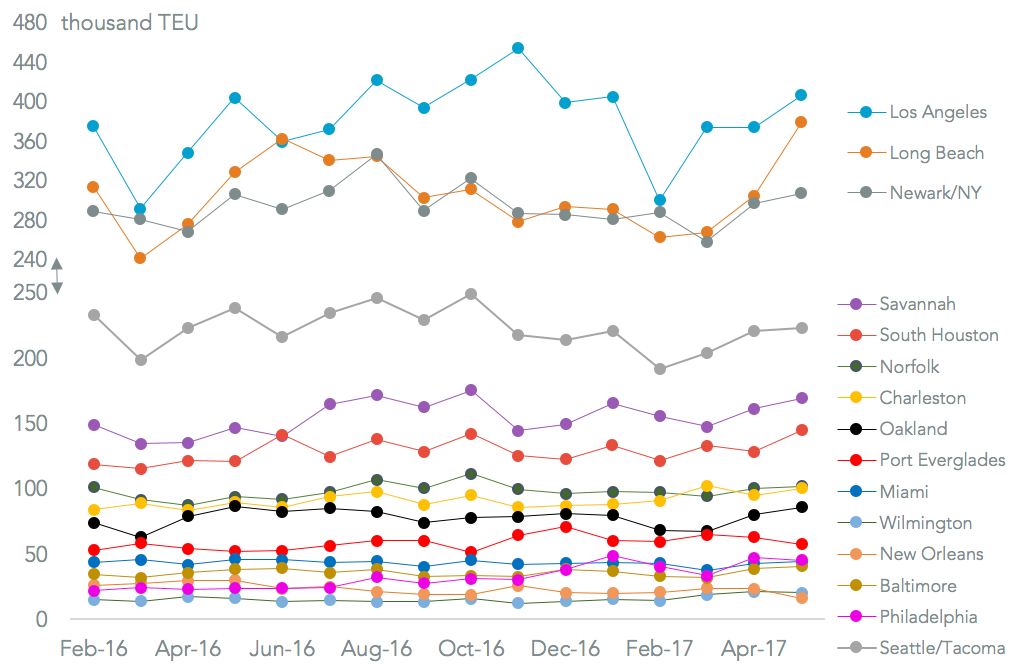
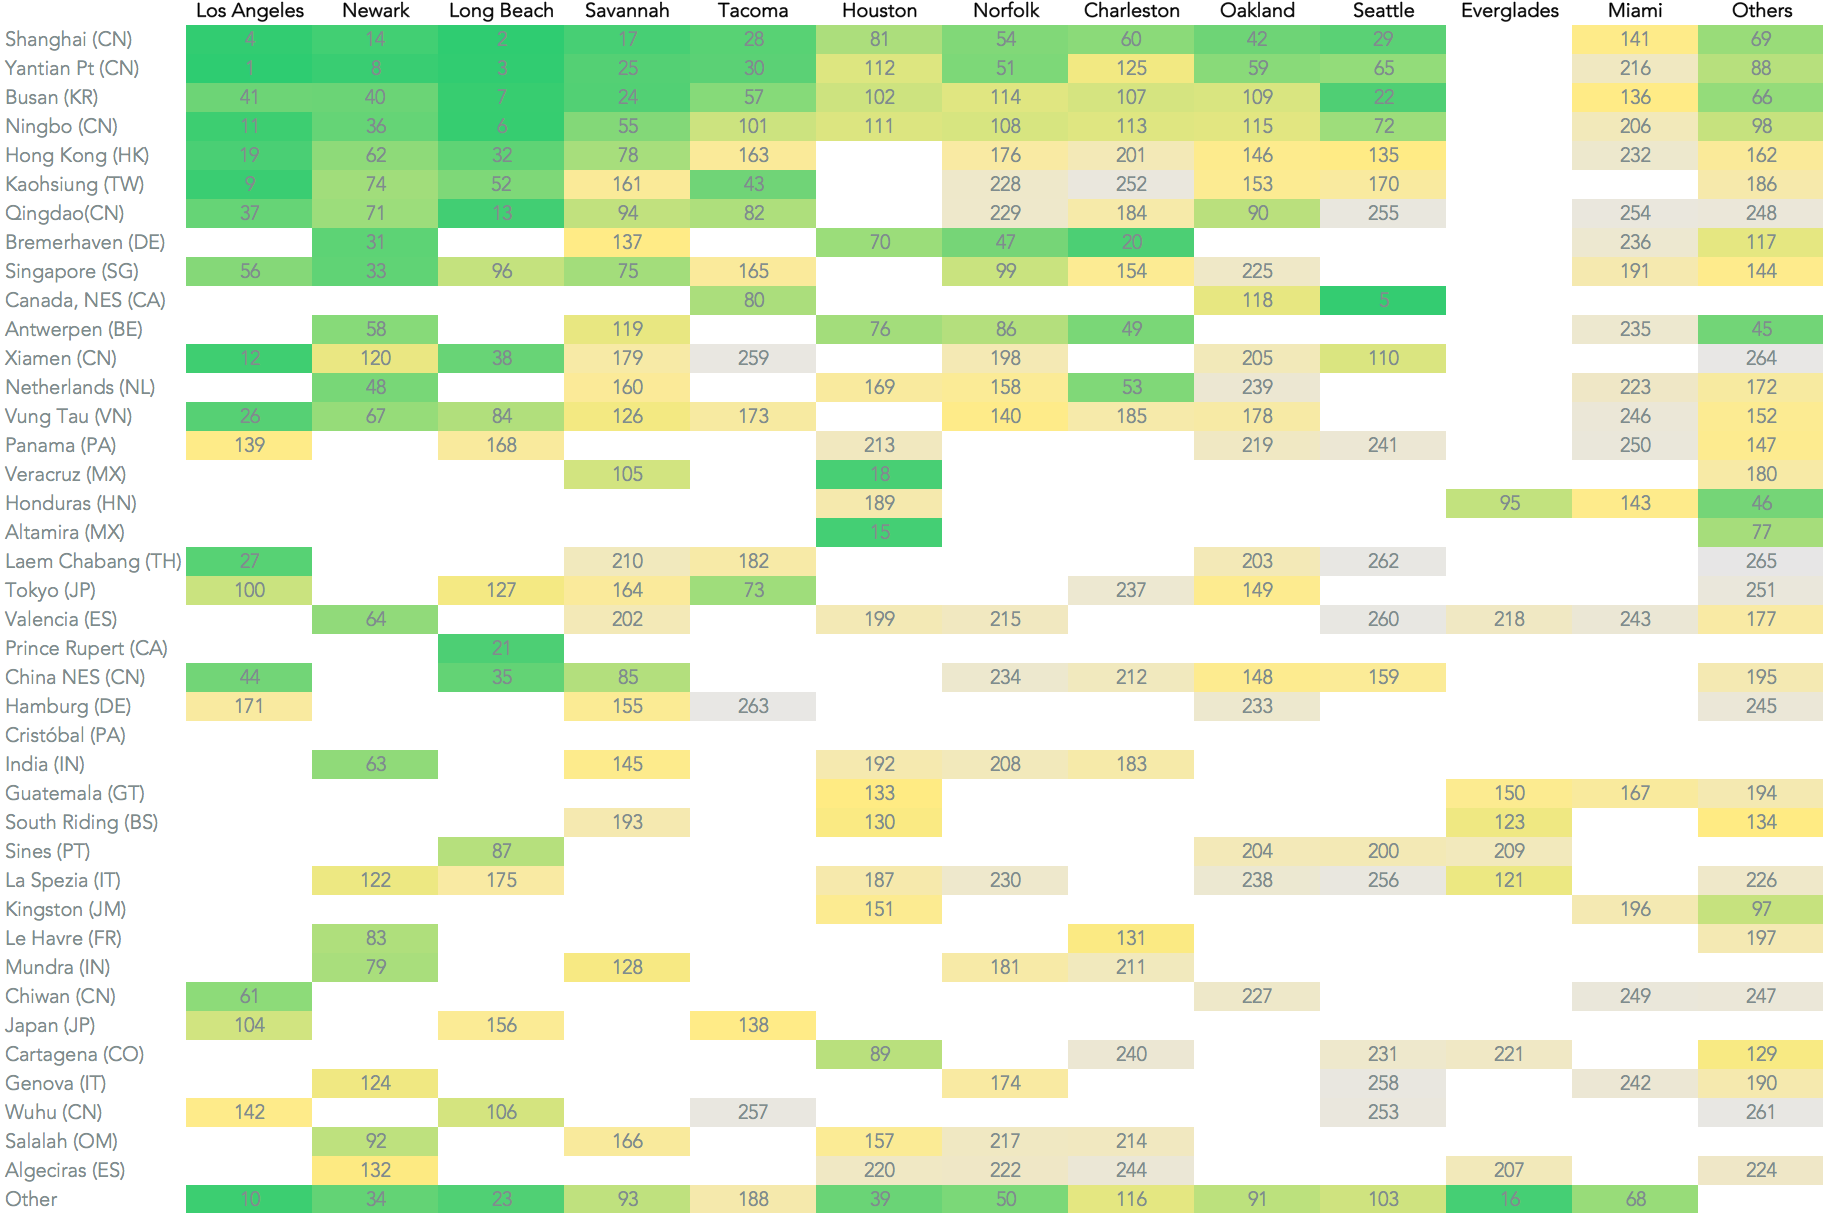
Panjiva analysis of over 500 port-to-port pairs shows Long Beach has pulled ahead of New York on almost all Asia inbound routes aside from Vietnam, while the eastern seaboard port remains dominant on routes from India. Furthermore, New York should see a return to growth in June and July as the Bayonne Bridge raising project is completed.
Source: Panjiva