 En
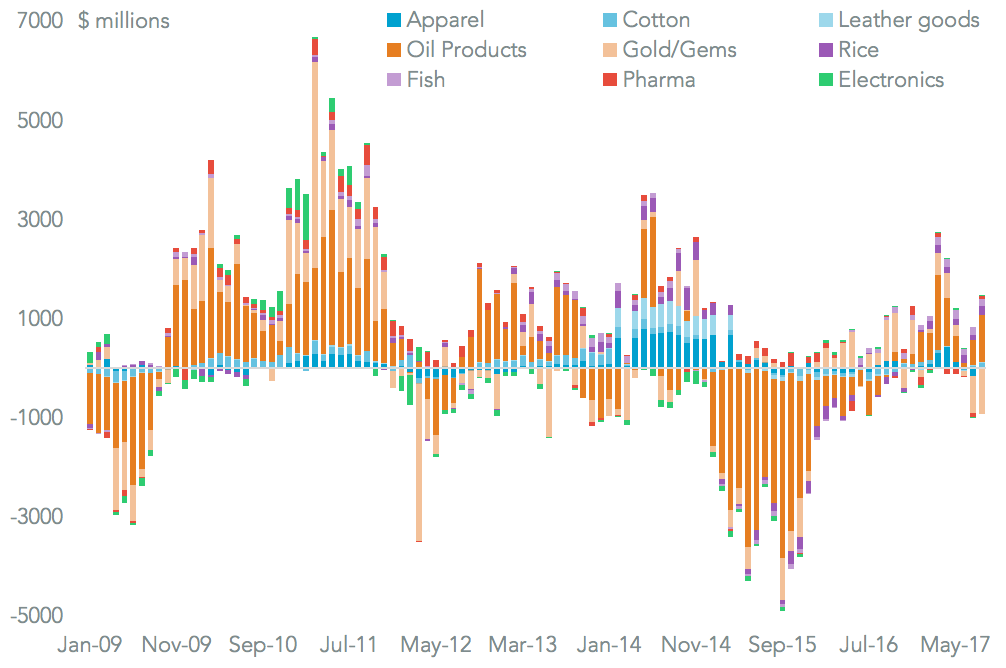
EnTextiles (including materials, fabric, apparel, footwear and leather goods) account for 11.5% of Indian exports, Panjiva analysis of official data shows, making them the third largest export group after gold/gems and oil. Exports of textiles have generally been in decline until recently, with a 4.3% drop in apparel and 1.3% in leather goods in the 12 months to July 31 on a year earlier, while cotton has done better with a 5.1% rise.
That comes in the context of an improving export situation across the economy, as outlined in Panjiva research of September 18. However, that has been largely driven by oil and gold rather than manufactured products. A recovery in textile exports, last seen in 2014, will be needed to ensure continued export growth.
Source: Panjiva
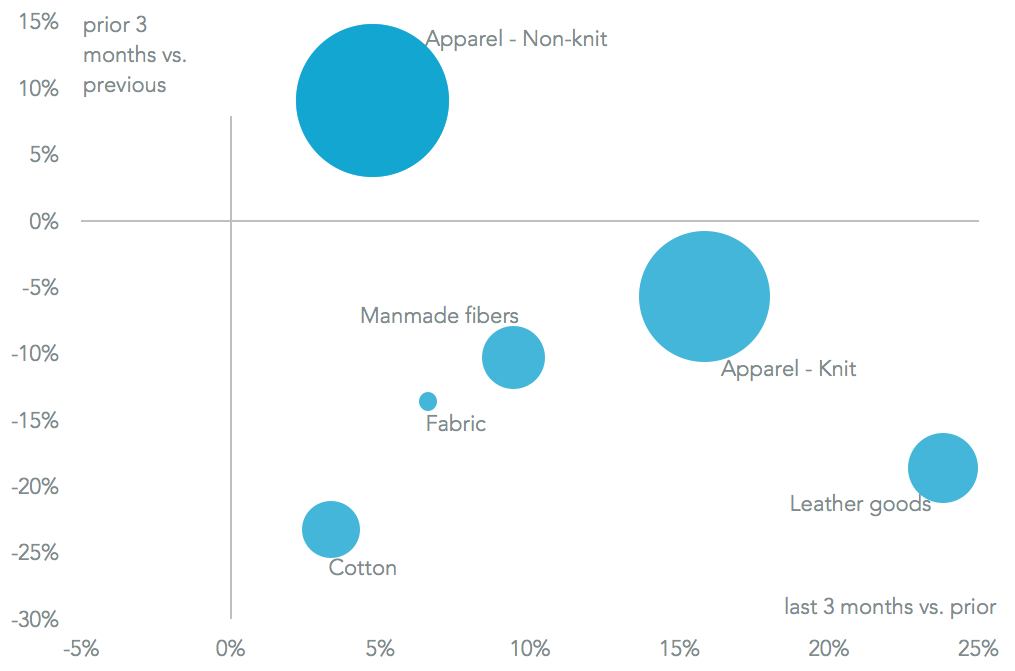
The recovery in the apparel value chain can be seen in Panjiva data for cotton, man-made fibers, fabrics, apparel ( knit and non-knit), leather-goods and footwear, shipments of which increased 8.3% sequentially in the past three months. That followed a more modest 0.8% rise in the prior quarter. The recovery has been led by a 15.8% growth in knit-type apparel, which had fallen 13.6% in the prior quarter partly due to natural seasonality.
Source: Panjiva
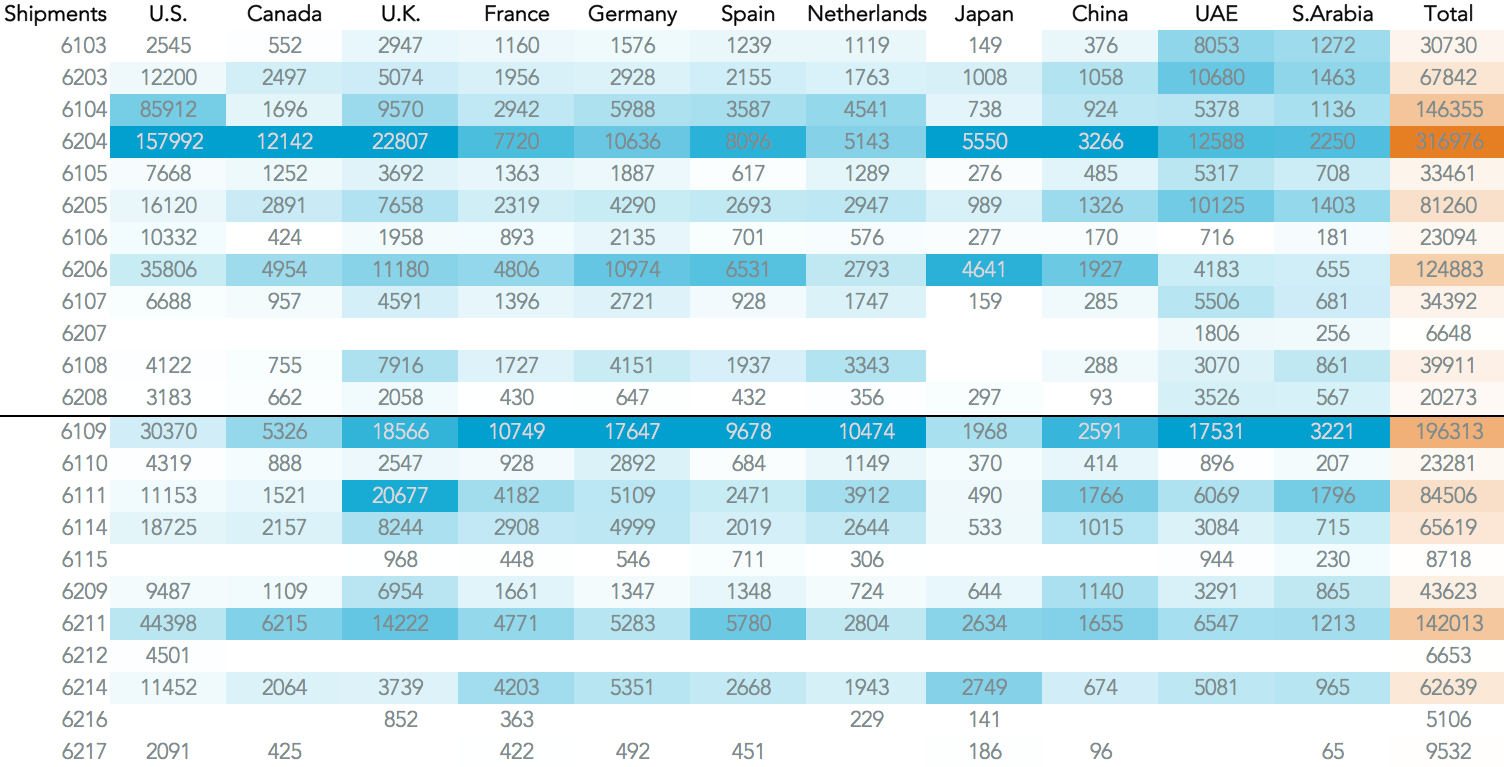
Panjiva analysis of over 2,400 country-product pairs show plenty of opportunities for Indian exporters to increase their product penetration in countries where they are under-represented. For example shipments to the U.S. of t-shirts, baby clothes and female underwear form a lower proportion of sales than they do for India’s global exports, suggesting room to increase sales.
In Germany that’s true for non-knit garments including female skirts / dresses and men’s suits/trousers. Meanwhile in Japan t-shirts and babywear exports are below India’s global average. The challenge for sales can be cultural as well as competitive of course.
Source: Panjiva


