 En
EnPanjiva’s latest dataset is trade data for India. This report provides a brief sketch of the key characteristics of India’s trade activity. For more information about Panjiva’s data and services please contact sales@panjiva.com.
Behaves like South Korea, Losing Ground to Vietnam
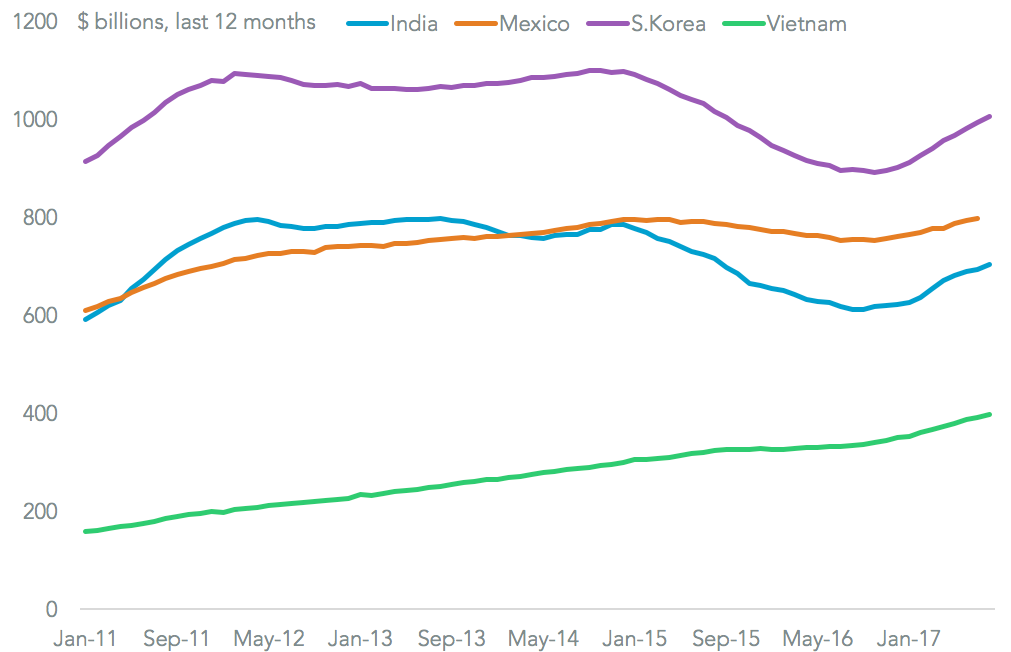
India’s total trade (goods exports plus imports) reached $703.6 billion in the 12 months to August 31, Panjiva analysis of official data shows, having experienced an 13.3% rebound in the past quarter on a year earlier. Longer-term, however, it has seen a 9.5% annualized drop over the past five years. That a similar pattern seen in South Korea (16.7% growth in the past quarter after a 6.2%) drop.
Both have seen a loss of manufacturing capacity to other, lower cost countries including Vietnam, which has seen an 81.6% annual growth in the past five years. That has resulted in India also falling behind Mexico – they had similar total trade levels in 2014, but India is now 10% smaller.
Source: Panjiva
Big trade deficit – not a big issue
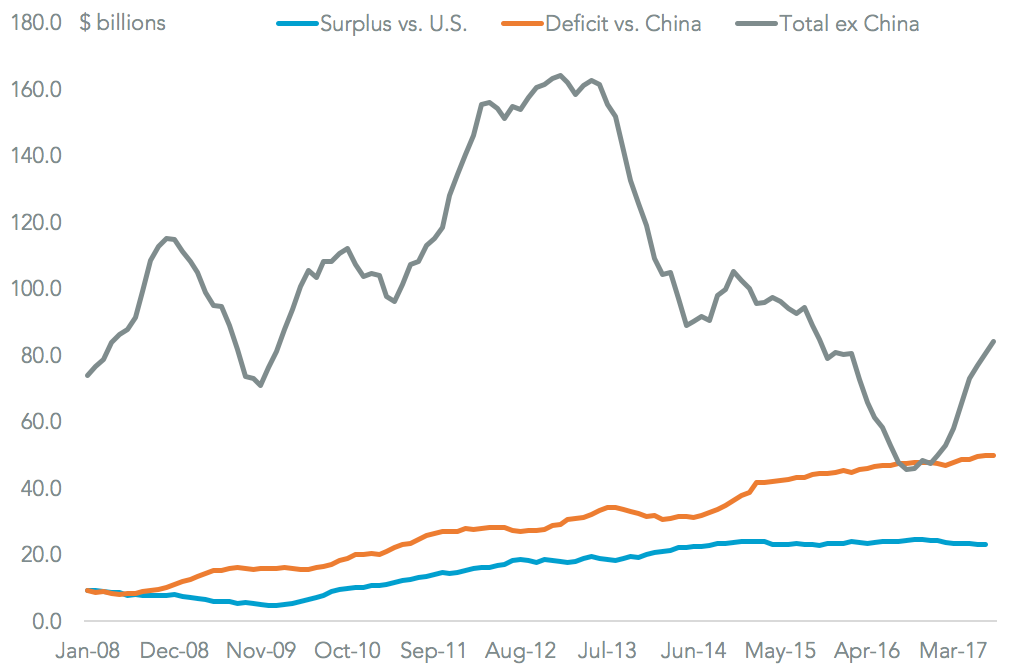
A major feature of Indian trade that differentiates it to many other Asian countries is its significant trade-in-goods deficit. This reached $134 billion in the 12 months to August 31, with $49.9 billion accounted for by China. Unlike the U.S., however, government trade policy is not driven by a preoccupation with the deficit. That’s partly because India also runs a $69.9 billion services surplus.
It does, however, run a trade surplus with the U.S. worth $23.0 billion which has led to critical commentary from U.S. Commerce Secretary Wilbur Ross, The Hindu reports. It has also led to a commitment by Prime Minister Modi and President Trump there is a push to look for “creative solutions” for expanding trade, as outlined in Panjiva research of July 17.
Source: Panjiva
EU and China matter more than America, Bangladesh more than Pakistan
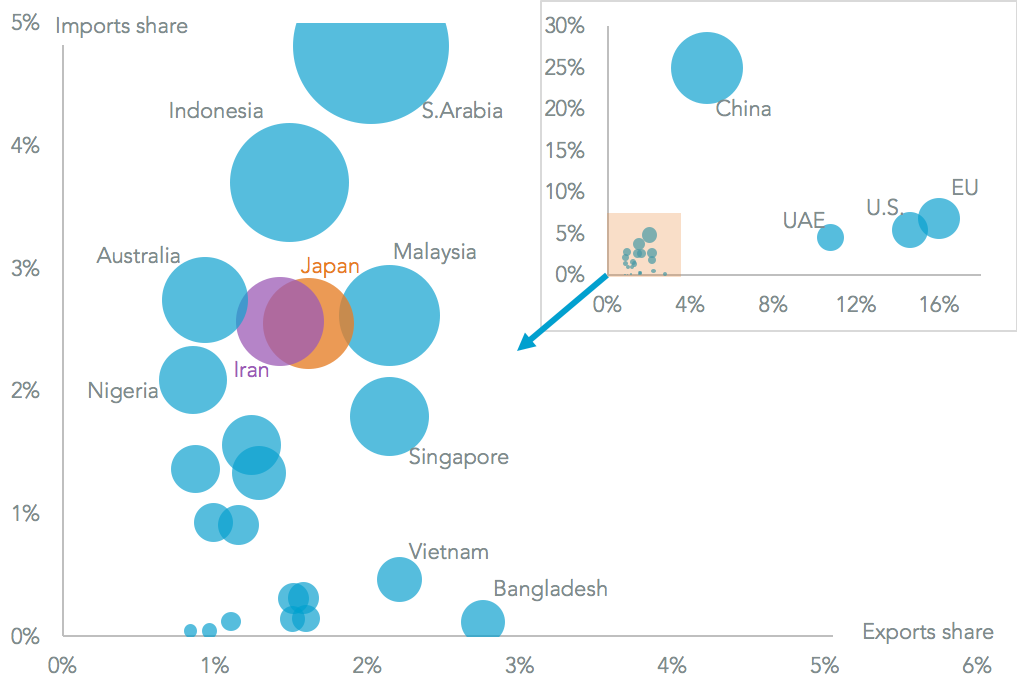
India has relatively few major trade partners, with the top four (China, the EU, the U.S. and the UAE) accounting for 43.2% of all trade and the top 25 representing 74.1% of all imports and exports, Panjiva data shows. India’s largest export market is the European Union at 15.99% of the total, closely followed by the U.S. at 8.7%.
From a long-term trade development perspective its relations with China are vital, with 24.9% of imports from there and 4.8% of exports going to China. That would explain India’s continued engagement with the RCEP trade deal process, despite regional geopolitical tensions.
Among the second tier of smaller suppliers there are a high proportion of oil exporting states including Saudi Arabia and Iran. Meanwhile neighbouring Bangladesh accounts for 2.8% of exports, making it the fifth largest export destination. Pakistan is only the 35th largest export market and 78th largest supplier.
Source: Panjiva
India’s thirst for energy, and phones
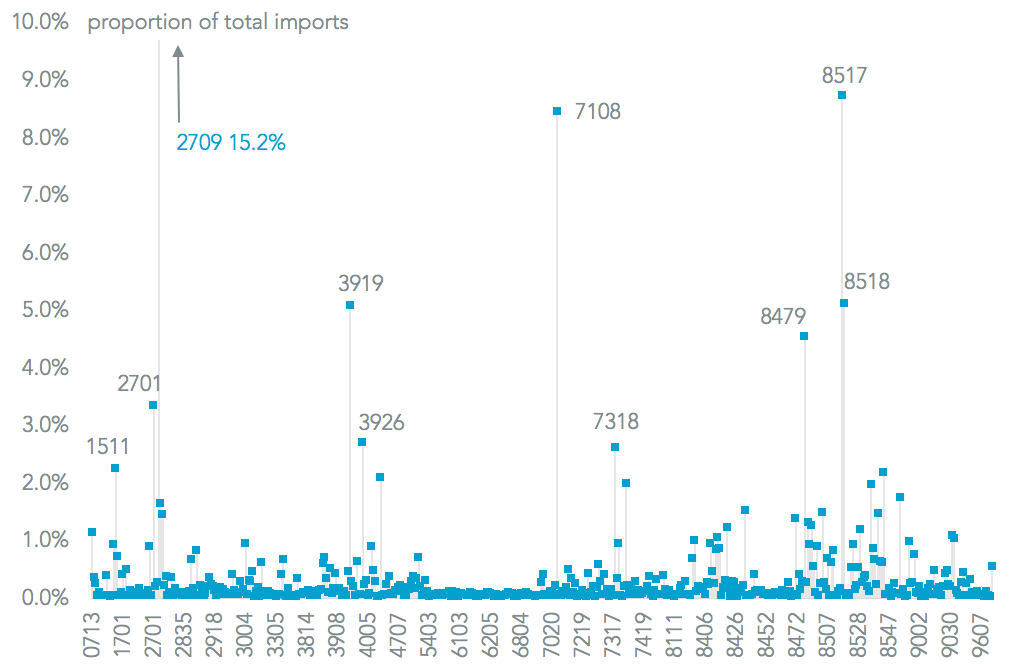
The reliance on overseas energy imports can also be seen in the mix of imports. Panjiva analysis of India’s top 500 import lines shows oil (HS 2709) accounts for 15.2% of the total with coal (HS 2701) being a further 3.3%. The country’s pace of development can be seen in the high proportion of consumer technology goods including phones and network equipment (HS 8517/8) which account for a combined 13.8% of purchases.
One area where Indian trade is unique though is the high proportion of non-monetary gold traded, which accounted for 8.4% of all imports in the past year. Finally, the country has a relatively low dependency on food imports, with palm oil (2.2% of the total) the largest import line.
Source: Panjiva
India dresses, and medicates, the world
On the export side of the equation there is a much higher level of diversification – the top 10 products only account for 26.0% of all exports. Among high-value added manufacturing the leading segment is apparel (15.1%), which appears to be starting something of a renaissance.
That’s followed by autos and parts (7.1%) and pharmaceuticals (4.5% of the total), especially generic drug supplies to the U.S. Agricultural exports are led by rice (3.2%) and fish (2.7%), while other significant commodity exports including steel/products (3.8%) and refined oil products (2.2%).

Source: Panjiva


