En
EnAt the start of the last quarter of the 2010s it is notable that many of the outstanding trade policy issues globally are similar to those that have been pending since the start of the year. That illustrates the lengthy timetable associated with trade negotiations – a facet often lost in the accelerated exchanges between the parties involved. To that end many of the most important events developing in the coming quarter – including the U.S.-China trade war, deteriorating relations between the EU and U.S. as well as Brexit – covered in the accompanying global trade policy outlook – may see their most important developments early in the quarter.
USMCA – Impeachment jetpack, election brakes
The launch of an impeachment investigation into President Donald Trump has raised the prospect that passage of the U.S.-Mexico-Canada Agreement could be delayed. The overall impact on trade activity in the region should be minimal given there is an extensive phase-in period for the legislation in any event. Furthermore House Speaker Nancy Pelosi has indicated that passage of USMCA should not be held up. Indeed the desire to show continued government business during the impeachment process could accelerate USMCA’s passage.
The ratification of the agreement by the U.S. Congress is currently held up in a back-and-forth between Congressional Democrats and the U.S. Trade Representative regarding issues ranging from labor and the environment to pharmaceutical prices and enforcement. Until a vote is called in the House there is no fixed timetable for passage in the U.S. Furthermore there’s the risk that a change in government after October’s Canadian elections could lead to a further review of the agreement’s terms.
One of the primary reasons for reviewing the original form of the deal – NAFTA – was the Trump administration’s concerns regarding the U.S. trade deficit with Mexico and Canada. Panjiva’s data for U.S. imports and exports shows that the total deficit reached $118.6 billion in the 12 months to Jul. 31 compared to just $69.3 billion in 2016.
That’s largely down to the automotive sector – see below – and energy. The U.S. deficit with Mexico and Canada in auto vehicles and parts reached $83.2 billion in the past 12 months from $68.2 billion in 2016 due to a surge in imports of vehicles and parts. In the energy sector the deficit increased to $49.6 billion from $29.2 billion in part due to higher oil prices and in part due to increased U.S. oil exports heading elsewhere in the world.
That leaves the “all other products” trade position as being a net surplus of $14.1 billion, though that was still down from $28.0 billion in 2016 due to increased imports from Mexico. The latter may be a result of the trade war with China and resulting diversions of sourcing.

Source: Panjiva
U.S.-China – Mid-October threshold for a mini-deal, or descent into post-tariff world
The U.S-China trade war is moving firmly beyond the bilateral imposition of tariffs. Non-tariff related issues that are now appearing include the impact of reform of CFIUS, a potential use of the International Emergency Economic Powers Act, questions around China’s currency float, the creation of a social-credit type “unreliable entities list” and most recently the return of capital controls. The latter, which could include investment limits for U.S. companies in China as reported by Bloomberg, are not under consideration by the U.S. Treasury “at this time” but could act as another arrow in the U.S. quiver.
From a timing perspective the next round of talks are scheduled for Oct. 10, at which point it should rapidly become obvious whether there is a deal – possibly a mini-deal like those being pursued with Japan and others as outlined below – to be done this year. The prospect of tariff increases to 30% from 25% on list three products on Oct. 15 could trip the talks up.
Most companies appear to now consider tariffs as a business-as-usual affair, though the list 4B products where tariffs are only due from mid-December may be treated differently. Outside of the major list 4B categories of phones and laptops there are signs of accelerated imports ahead of tariff increase.
Panjiva’s U.S. seaborne shipping data shows that there has been a 7.0% rise in imports of home appliances, including microwaves, from China in August compared to a year earlier. More importantly among seasonal goods there’s been a 10.5% jump in imports of toys and a 39.3% surge in shipments of home textiles.

Source: Panjiva
U.S.-Europe – All about jets, cars and big Phil
The prospect of a trade deal between the U.S. and EU seems low given the EU will only want a complete deal – rather than a tariff-focused mini-deal – and given the complexities that the ultimately abandoned TTIP deal faced. Furthermore, the U.S. and EU positions on climate change, including the Paris Agreement, are diametrically opposed – a likely red line for the French government at least in launching talks.
The lack of willingness to start negotiations, even under the new EU Trade Commissioner, Phil Hogan, may mean that the Trump administration will see the EU more as a “convenient enemy”.
In the very short term a hurdle to improved relations is the World Trade Organization approval for U.S. retaliatory duties against EU subsidies for Airbus. The final list of products to be targeted needs to be approved by the WTO, giving a small window for negotiation which the U.S. Trade Representative has previously said is aimed at the “ultimate goal to reach an agreement with the EU” to end all aerospace subsidies.
The focus of America’s retaliatory duties so far has been on the food / agricultural elements of the lists of products given out already by USTR. There’s a good chance however of capital goods importers in the U.S. being hit with the new tariffs.
Panjiva’s seaborne shipping data shows that firms importing products in the capital goods sector include JCB, Doosan Infracore and Liebherr. There’s some evidence of stockpiling already with seaborne shipments linked to JCB having increased by 41.9% year over year in the three months to Aug. 31, while those associated with Doosan have climbed by 73.0%. Not all companies are stockpiling though, with shipments associated with Liebherr down by 26.0% over the same period.

Source: Panjiva
U.S. Section 232 Automotive Sector Review – The stick that may be a damp squib
The U.S. section 232 “national security” review of the automotive industry was completed in February, but President Trump has until mid-November to make a decision. There’s the possibility that Congressional pressure could lead to an earlier release of the underlying report, Inside Trade reports.
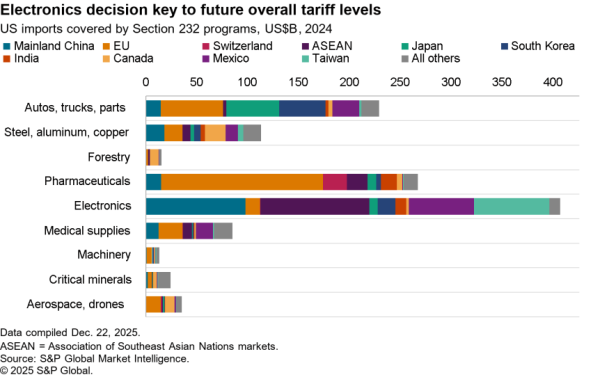
Ultimately though the tariffs may prove to be a damp-squib as most U.S. automotive imports have already been excluded via earlier trade deals including USMCA, South Korea and probably Japan which together accounted for 71.3% of the $353.8 billion of automotive parts and vehicles imported in the 12 months to Aug. 31.
That leaves the EU which accounted for 18.3% and China with 4.7% that are likely to be targeted unless there is progress on trade negotiations with those parties. In the case of the EU 14.6% points of the 18.3% are vehicles, where it will be difficult to make a national security argument.
If only imports of parts are considered in the review then just $43.3 billion of imports, or 12.2% of the industry total, could be set to be at risk from the tariffs. The new rules may even just focus on high technology parts for electric and autonomous vehicle systems. As a counterpoint though unions, including the UAW which is currently striking against General Motors, may not accept a partial deal that doesn’t replicate the breadth of coverage of the earlier section 232 review of the steel industry (see below).

Source: Panjiva
U.S.-Japan – Maximizing the mini-deal
While a mini-deal with Japan has already been agreed the text of the agreement calls for a comprehensive trade deal to be reached within four months of the formal signing of the mini-deal. The whole thing would likely then have to pass through the U.S. Congressional TPA process – as well as the Japanese Parliament – before coming into force.
Much of the focus on the deal so far has been in relation to potential winners from the mini-deal in agriculture and a few items in capital goods. A full deal would, however, help U.S. businesses more broadly by cutting a wide range of industrial tariffs.
Some of the highest are in titanium products (HS 8108.20) at a rate of 15.0% while imports of valve and bearing components (HS 8481 and 8482) carry duties of up to 5.8%. Seaborne imports of those products have been recovering recently with total U.S. seaborne imports of them up by 24.5% year over year in the three months to Aug. 31. The largest importers may include NSK, whose shipments increased by 15.8% year over year in the same period alongside Jtekt which experienced an increase of 14.9%.

Source: Panjiva
U.S.-India – Gasping for GSP, but drugs means its not desperate
The U.S. and India don’t have a formal trade negotiating process underway, and with elections having passed on India’s side there may be little urgency in negotiating a deal. India’s export growth to the U.S. has also been strong with a 10.2% year over year increase in the 12 months to Jul. 31. Yet, the loss of Generalized System of Preferences access from June may trim that growth eventually, providing at least one reason for India to come to the table.
The expansion in India’s exports so far has been driven by non-GSP products. That’s been led by a 16.5% surge in shipments of pharmaceuticals, a 25.0% rise in exports of refined oil products and a 51.1% jump in exports of vehicles.
Exporters of pharmaceuticals may insteady be more exposed to wider U.S. healthcare policy changes than simply trade policy. A bipartisan desire to cut healthcare costs could hinder Indian exporters by increasing competition with shipments from Canada or provide a wider market opportunity by widening access for generic pharmaceuticals.
Leading exporters from India to the U.S. of pharmaceuticals include Aurobindo, whose shipments climbed 20.8% year over year in the 12 months to Jul. 31 to reach $557 million, followed by Dr. Reddy’s with $432 million of shipments after losing ground to Cipla.

Source: Panjiva
U.S.-Vietnam – The convenient enemy
Should the Trump administration fail to gain traction in negotiations with China or the EU it may look for an alternative “convenient enemy” in the form of Vietnam. The government of Vietnam is already endeavoring to preempt the risk of tariffs – say through a section 301 review – by focussing on preventing transshipment as well as increasing purchases of U.S. liquefied natural gas.
Vietnam has also been a major beneficiary of companies redesigning their supply chains in response to the U.S.-China trade war, though that has reportedly started to strain infrastructure in Vietnam. The biggest driver in absolute terms of the expansion in seaborne imports to the U.S. from Vietnam has been a 43.2% surge in shipments of furniture, which alone represented 26.7% of the increase in shipping traffic. That was followed by a 46.3% surge in apparel and textile imports as well as a 46.8% jump in footwear.
With new tariffs on those product lines shipped from China starting in September and being expanded in December it’s possible that those figures could increase further – alongside the risk of a policy intervention by the U.S. government.

Source: Panjiva