 En
EnContainer-lines operating on U.S.-inbound routes will have had a tough period of competition in February. Total imports declined 8.0% in shipment terms on a year earlier, as discussed in Panjiva research of March 7, while the ports handled 7.1% fewer containers.
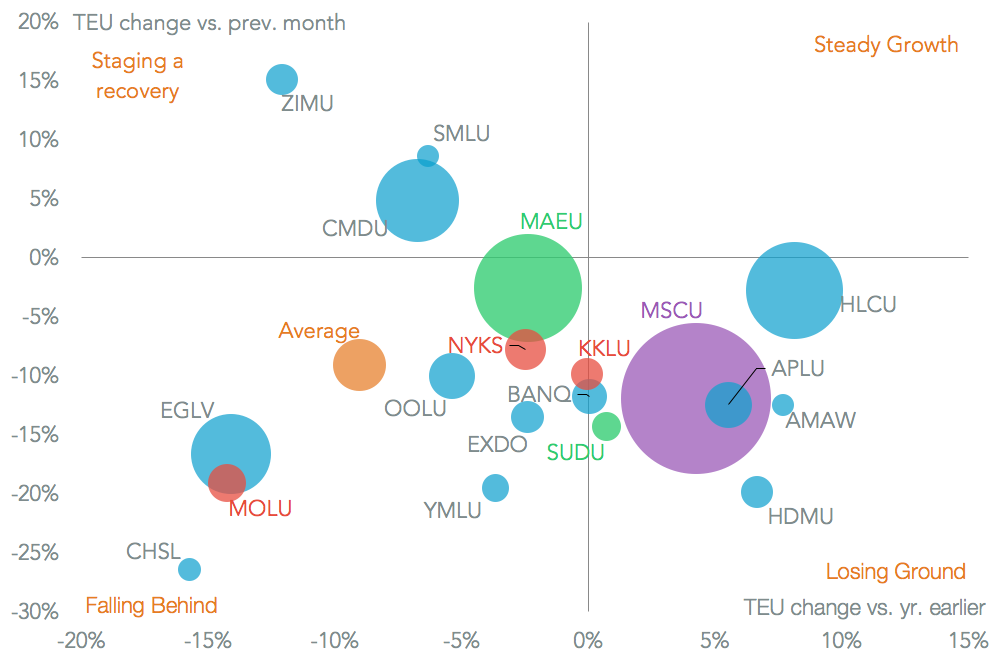
Yet, despite the shrunken market vs. a year earlier 16 of the top 20 shippers did better than this in terms of the volumes they shipped into U.S. ports, Panjiva data shows. Generally the European domiciled shippers did better than others, with Hapag-Lloyd expanding 8.1% on a year earlier and MSC by 4.2% The decline in traffic was not all about the lunar new year holiday as Asian shippers APL (affiliated to CMA-CGM) and Hyundai Merchant Marine also increased by 5.5% and 6.6% respectively.
Source: Panjiva
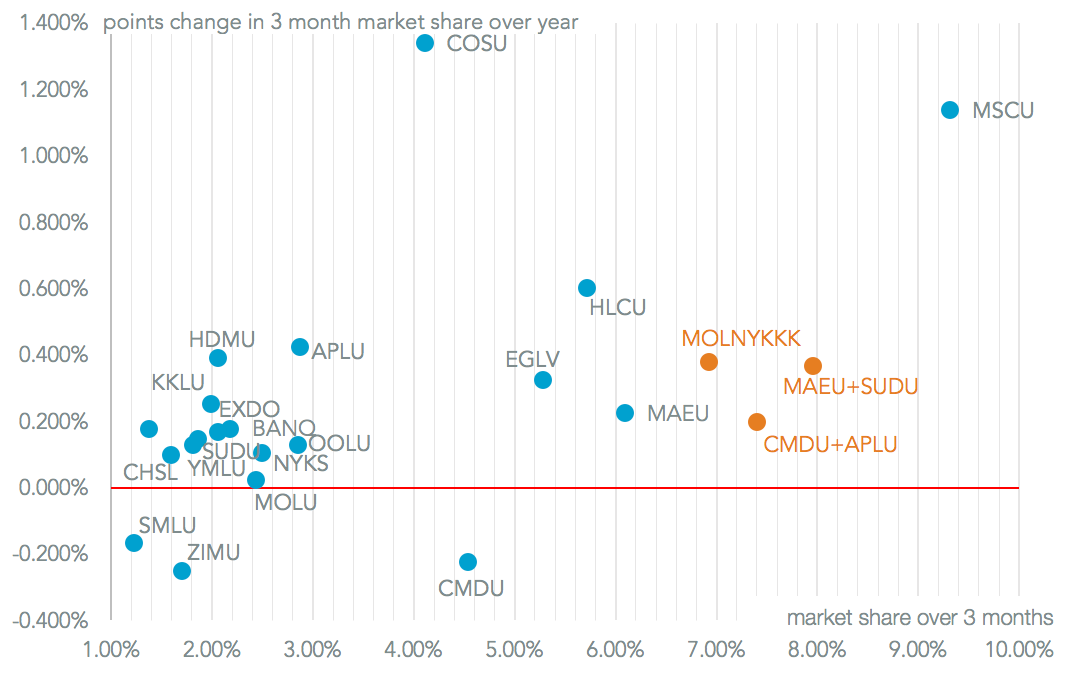
Even before the formal consolidation of the three Japanese shippers and Maersk with Hamburg Sud takes effect already seeing the top five operators build market share. Jointly the “2018 top 5” held a 37.3% share of volumes in the three months to February 28, which was 2.68% points higher than the same period a year earlier. While many of the smaller players are already in, or forming, alliances this tendency towards consolidation may well drive further dealmaking. CMA-CGM has recently alluded to as much.
Source: Panjiva
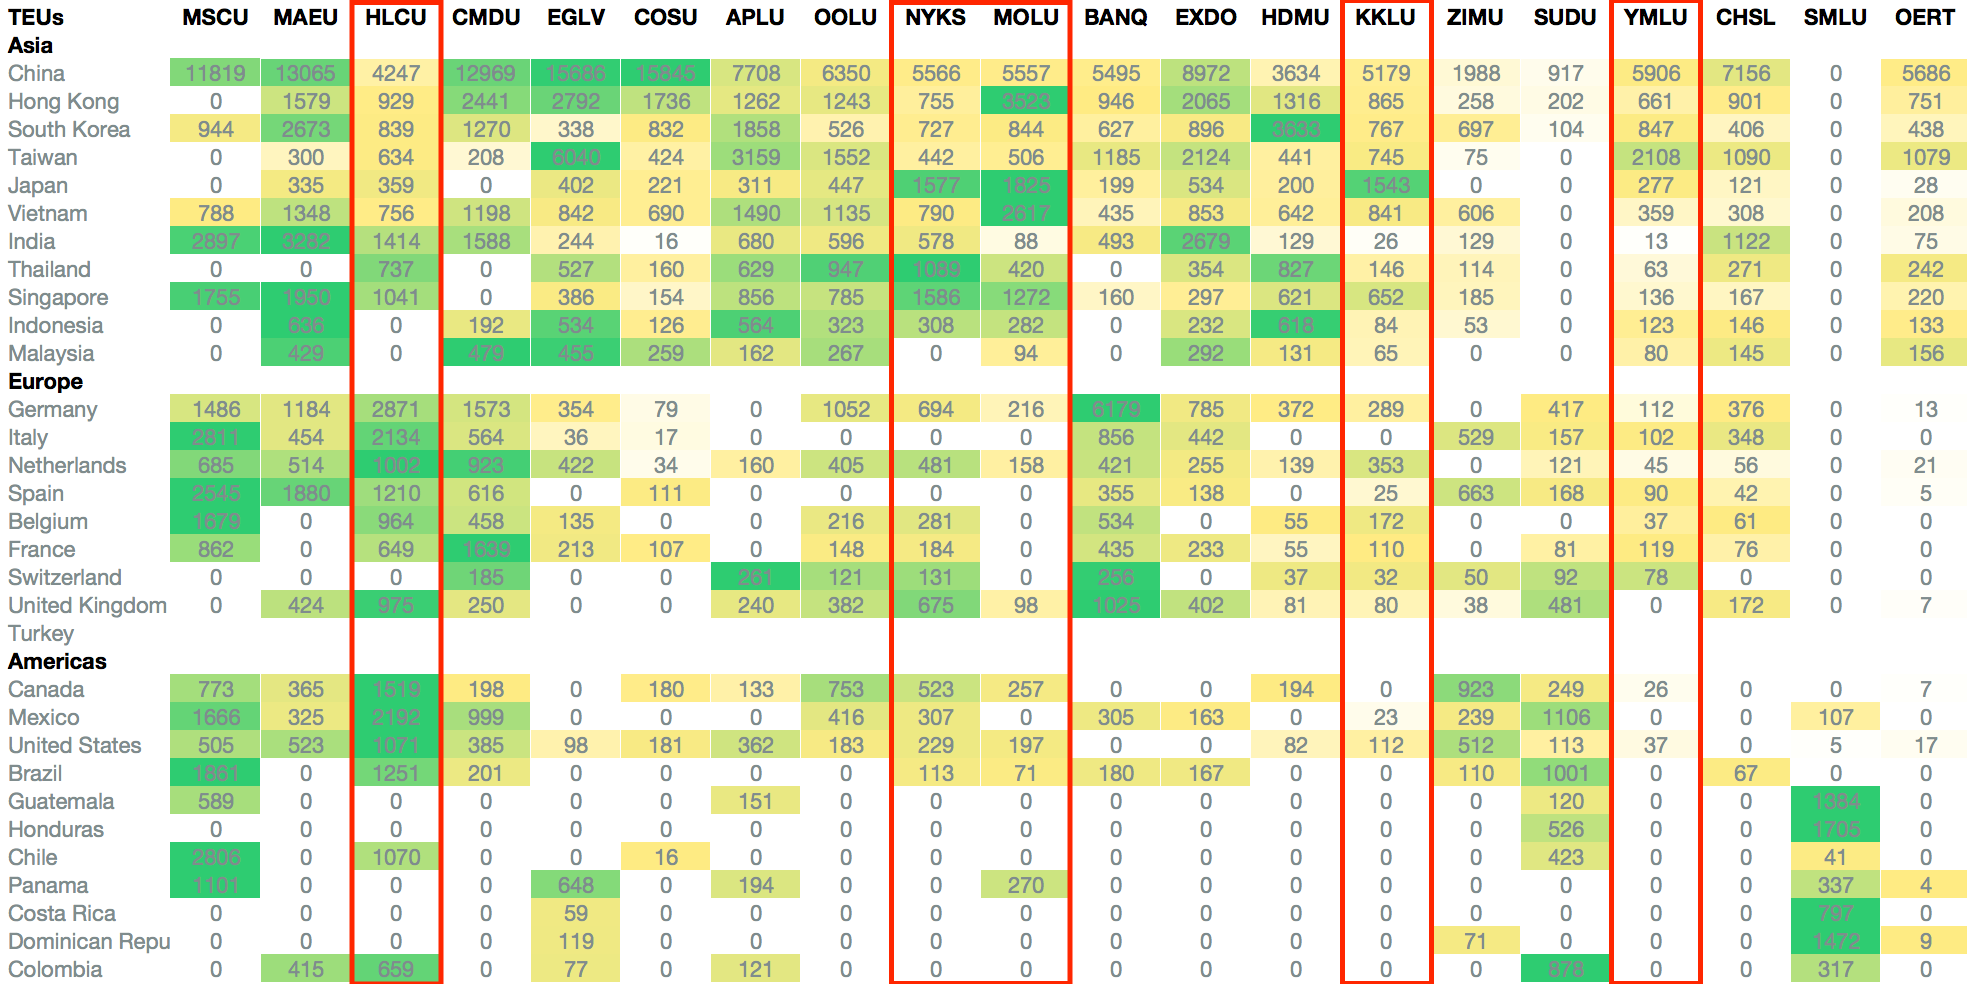
One of the drivers of forming alliances is relevance to customers as well as scale. That appears to be a major driver behind THE, which recently finalized its route structures and services ahead of a formal launch in April. Panjiva’s analysis of the top 600 carrier / country pairs shows how it brings together Hapag-Lloyd’s Europe- and Americas-led profile with that of the Japanese and Taiwanese shippers in the alliance.
Source: Panjiva


