 En
EnU.S. seaborne imports surged 13.0% higher vs. a year earlier in February, Panjiva data shows, making for the fastest rate of expansion since February 2016. That’s partly explained by the later-than-usual timing of the lunar new year, and is likely to result in a correction in March.
The optics of surging imports make a difference nonetheless, particularly with the Trump administration considering a broad range of tariffs on Chinese imports as part of the section 301 review of its IP policies, outlined in Panjiva research of March 8.

Source: Panjiva
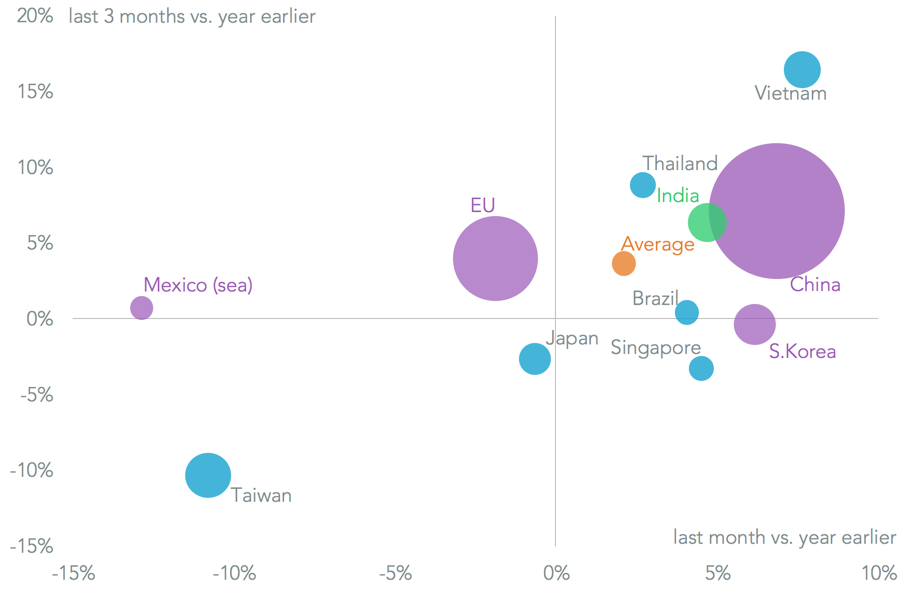
That timing effect partly led to a 23.7% surge in imports from China, including Hong Kong, putting it well ahead of other markets except Vietnam (30.1%). Notably Taiwan saw a – possibly temporary – recovery back to growth with a 1.9% increase in shipments after nine straight months of decline. The only major country tracked by Panjiva that saw a decline was Singapore, which fell 12.7%.

Source: Panjiva
Products that have a high proportion of production in China also saw a more rapid growth including furnishings (24.7%) and toys (27.6%) as a potential pre-emption of tariffs. There is also likely a similar effect seen in imports of iron and steel which increased 19.0% (the fastest expansion since March 2015) and of the launch of section 232 tariffs. Even perennial underperformer apparel rose 12.3%. All the major product groups tracked by Panjiva experienced an increase, with the slowest being energy (including coal, oil and gas) which rose by a more modest 4.2%.

Source: Panjiva
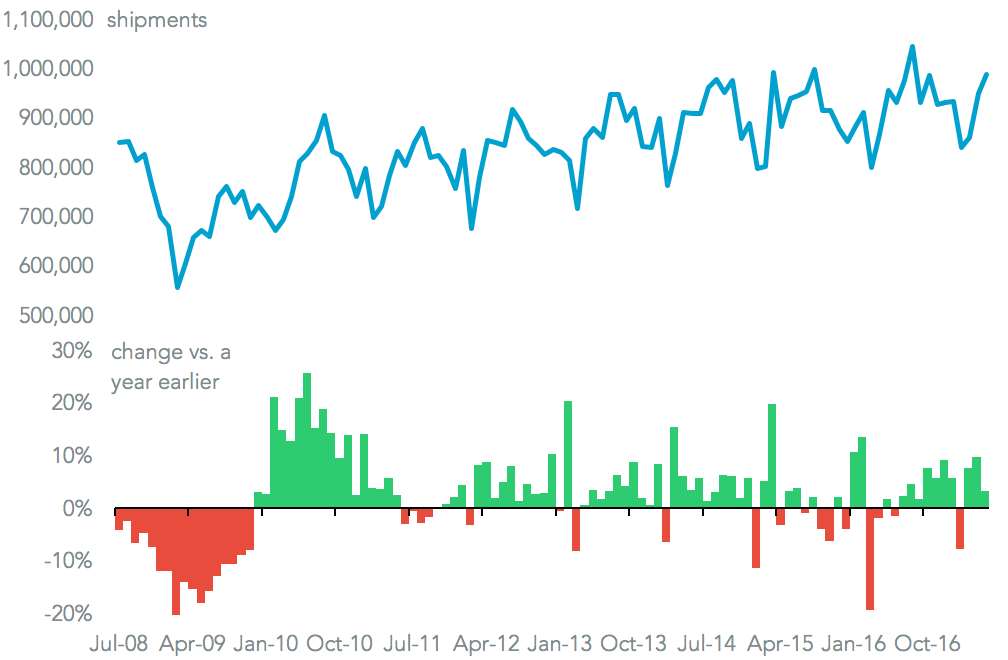
The acceleration in imports on a quarterly trailing basis, at 8.1%, was the fastest rate since February 2013. That’s been supported by a mixture of robust consumer confidence (at its highest since November 2000 S&P Global Capital IQ data shows), business confidence (at an 11 year high according to the ISM survey), as well as potential attempts to “beat the tariff”. The latter may continue in March even as tariffs in metals begin assuming no short-term announcement of section 301 tariffs (or concerns about backdating).

Chart compares growth in U.S. seaborne imports on a quarter (bar) and monthly (dot) basis. Source: Panjiva
]]>
U.S. imports opened 2018 with a bang, Panjiva data shows, with seaborne shipments in January having risen 7.7% on a year earlier. That was the fastest rate of growth since April, and well ahead of the 4.1% recorded for 2017 as a whole. It also comes after a record year for U.S. imports in aggregate, as outlined in Panjiva research of February 26, which in turn led to a record trade deficit.

Source: Panjiva
Among the main supplier economies a 10.3% jump in shipment from China was the main driver, and continues a run of growth going back to February. That growth may continue in the coming month as the lunar new year holiday is later this year, and so will only cut shipments leaving from mid February rather than late January.
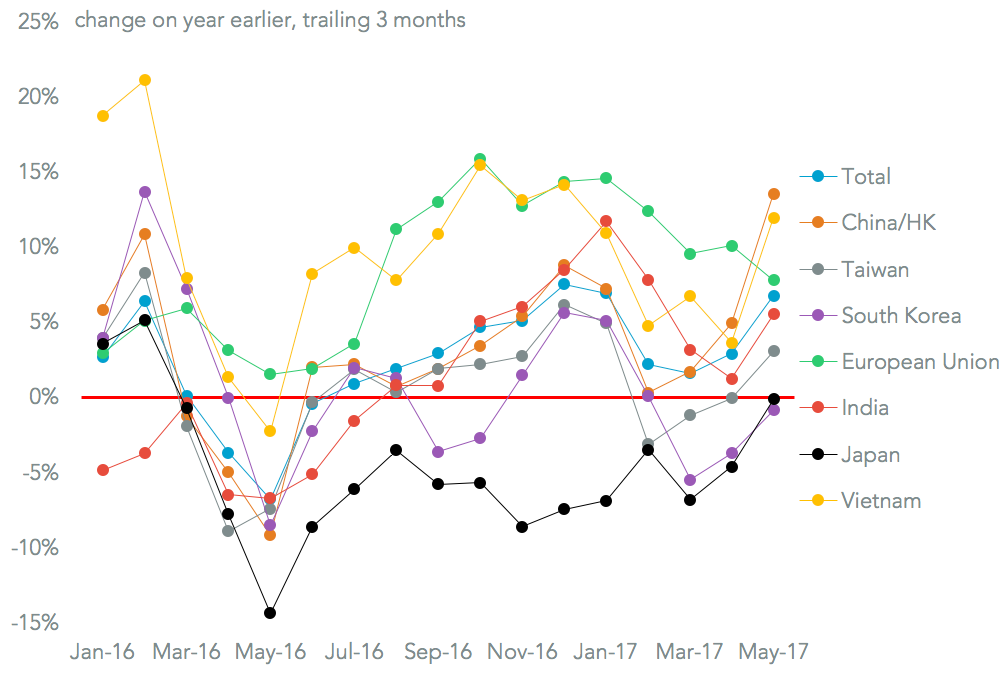
Exports from developing economies with expanding manufacturing sectors continued, with shipments from India having increased by 15.2% while those from Vietnam improved by 13.3%. The more mature markets of Taiwan (down 1.2%) and Japan (off by 0.2%) lost out, though the European Union continued to grow its shipments to the U.S. with a 4.9% improvement.

Source: Panjiva
All the major product groups tracked by Panjiva saw growth for the first time since February 2016. Autos were the slowest at 2.7% while toys (13.0% higher, beating the seasonal lull) and machinery / electronics (up 12.2%) being the fastest. That likely reflects three major factors which may remain supportive for imports for the next couple of months at least.
American business confidence remains high after the tax reform, leading suppliers to expect an increase in investment. Consumer confidence has begun to slip from 10 year highs according to Bloomberg, though spending growth has continued.
Third, while the Trump administration has begun to implement tariffs on imports these have yet to be widespread, with only washing machines and solar panels seeing significant moves so far beyond normal anti-dumping cases.

Source: Panjiva
]]>
#1 Trump’s GSP renewal could leave India out (Jan 4) The Generalized System of Preferences allows duty free imports of 5,000 products to the U.S., with India the largest beneficiary. It has now lapsed, and while the Trump administration is expected to renew it, there may be adjustments. India has $23 billion trade surplus with the U.S., though only 14% points of the top 65% of its exports are eligible. One alternative is to target specific products for exclusion including auto-parts or aluminum.

Source: Panjiva
#2 K+N looks east for deals, but has competition (Jan 8) K+N’s Chairman, Joerg Wolle, has indicated the company is looking for bolt-on deals in Asia. That would put it in competition for assets with Panalpina and DSV, though a wide range of consolidation in the fragmented forwarding industry is needed. Potential targets on Asia-U.S. routes would include Kerry Logistics, Orient Express or Honour Lane among larger firms, while mid-sized operators include Hecny or De Well.

Source: Panjiva
#3 Action on metals possible after Trump-Xi call (Jan 17) A phone call between President Xi and President Trump included a discussion of how to address the trade imbalance between the two countries. Xi called for a continued economic dialogue, while Trump referred to the deficit as being “not sustainable”. That heightens the likelihood of increased U.S. tariffs in the context of the section 301 review of Chinese IP practices. Should the President wish to avoid hitting consumer goods, the largest Chinese export lines to the U.S. where tariffs could be applied include base metals ($12 billion) and plastics ($13 billion).

Source: Panjiva
#4 201 down, 6 to go (Jan 22) President Trump’s willingness to take action on consumer goods was proven a few days later when he applied tariffs of up to 50% on washing machine imports and 30% on solar panels under the section 201 “safeguarding reviews” of each product. Manufacturers of both had raced to build inventories, with washing machine imports in the fourth quarter being 194% higher than in the first, and solar power equipment 199% higher.

Source: Panjiva
#5 26 actions taken, deficit still rising (Jan 18) One year on from the inauguration we identified 26 specific actions on trade policy taken by the Trump administration ranging from renegotiations of trade deals, new trade cases of varying stripes (see above) as well as several items left on the to-do list. Yet, while the President has kept his promise to act, the trade deficit has continued to grow and breached $50 billion for the first time in November since January 2012.

Source: Panjiva
#6 Black swan risks for 2018 (Jan 5) Out of the eight reports we published in our 2018 Outlook series it was the attempt to spot low-probability / high-materiality risks for global supply chains that got the most attention. Conflicts in the South China Sea or Middle East worry us most, while a simultaneous NAFTA failure / border wall combination could have more mundane but still expensive consequences. Port labor disputes in response to automation plans could strike later in the year, while mega-mergers in the container-line space are still a possibility if profits don’t recover.

Source: Panjiva
#7 CH Robinson bests Nippon Express (Jan 31) The freight forwarders’ 4Q earnings may be better than anticipated, with both CH Robinson and Nippon Express reporting higher revenues than expected (CH Robinson did slightly better) and profit margins inline with analysts’ forecasts. Yet, both are below the industry average 11% EBITDA margin. The main risk remains a price war that could be triggered by the U.S. tax reform’s impact on corporate tax rates.

Source: Panjiva
#8 Record 2017 volumes for forwarders (Jan 11) Freight forwarders had a record 2017 in terms of U.S.-inbound seaborne freight with a 4% rise in December. Orient Express was the most aggressive in expanding in December (16% higher) while Expeditors took a step back (down 1%). That took Orient Express up three places to third in the volume rankings. Our full year trade-lane analysis showed only Expeditors and K+N have more than a handful of top three ranks, indicating the degree of fragmentation and need for consolidation in the industry.

Source: Panjiva
#9 Make-in-India comes to the fore (Jan 25) The Indian government announced, or was reported to be ready to implement, several protectionist measures to support the “Make in India” strategy in January. We covered the phenomenon in a series of reports, including an analysis of how it could spoil an attempt to build relations in the ASEAN region. At particular risk are relations with Singapore, Thailand and Vietnam on the basis of their consumer electronics exports to India.

Source: Panjiva
#10 NAFTA to die another day (Jan 30) The sixth round of NAFTA talks was to have proven pivotal, and needed an agreement on automotive rules-of-origin to avoid a U.S. withdrawal. Yet, the three parties appeared to consider negotiations beyond the previous March deadline, leaving the process free to continue for now. The U.S. rejected Canada’s suggestions on altering the weightings used in ROO calculations, casting doubt over the supply chains of General Motors and Fiat-Chrysler in particular.

Source: Panjiva
]]>
U.S. imports ended the year on a high note with a 3.8% increase in seaborne shipments in December, Panjiva data shows. That was the 17th increase in the past 18 months, and brought the total for 2017 to a 4.1% rise to reach 11.6 million shipments.

Source: Panjiva
The performance of trade during the latter part of the year shows some evidence for the “ship later” strategies being followed by retailers and other importers as they seek to optimize inventories. In 2017 16.8% of full year shipments arrived in November and December, compared to 16.7% in 2016 and 16.3% in the prior five years. For early 2018 it is worth noting that lunar new year starts 19 days later than in 2017, potentially flattering January and February figures.

Source: Panjiva
As has been the case for most of 2017 the fastest growing major exporter to the U.S. has been Vietnam, with a 17.3% increase in December and 12.6% for the year as a whole. That’s been driven by a relocation of manufacturing capacity from mature Asian markets including Japan (down 3.2% for the year) and Taiwan (6.8% lower). Vietnam has now consistently outpaced Japan as an exporter to the U.S. since April 2017.
Yet, China remains the dominant reason for U.S. import growth though with a 7.1% rise for the year. That may soon come to a halt though, as outlined in Panjiva research of January 8, if the Trump administration makes good on its threat to apply broad-based tariffs in retaliation for intellectual property rights rules violations.

Source: Panjiva
At the product level the strength in consumer and business sentiment in the U.S. continued to make itself felt. Among consumer durables imports of furniture climbed 7.4% in December to end the year 8.7% higher. With 51.9% of imports of furniture having come from China in 2017 that may be an area for tariffs to be applied if the Trump administration are willing to make consumers bear the price of not buying American.

Source: Panjiva
The worst performing major sector for the year autos which saw a 2.3% decline in shipments for the year overall as light vehicle sales dropped. Second worst was apparel with a 0.7% decline for 2017, though a 4.1% growth in December suggests a turnaround may be underway. At the business level imports of machinery and electronics climbed 7.5% to end the year 6.8% higher. With business sentiment regarding trade in the U.S. at the highest since 2014, and at multi-year highs globally, it would be a surprise to see an end to import growth in the near term without significant protectionist policy intervention from the government.

Source: Panjiva
]]>The growth in U.S. imports seen throughout 2017, with the exception of February, accelerated in November. Seaborne shipments climbed 5.6% on a year earlier, Panjiva data shows, reaching 10.625 million for the month.

Source: Panjiva
The longer term trend of a rotation of manufacturing capacity, and related exports to the U.S., from the more-developed to less-developed Asian economies. Shipments from Vietnam soared 18.7% higher and those from Thailand climbed by 15.0% while those from Taiwan fell by 8.8% (the seventh straight drop) and from South Korea there was a 1.1% decline.
China remained the number one supplier after an 8.3% rise – it’s 2.6x the imports from the EU – and number one generator of the expanding U.S. trade deficit, as outlined in Panjiva research of December 5.

Source: Panjiva
At the product level the most marked turnaround was the apparel sector. Imports expanded by 6.9%, the fastest rate of expansion since February 2016. That may indicate that the steady process of moving to leaner inventories may have reached a conclusion.
By contrast shipments of toys fell by 0.4% vs. the prior year after three months of growth, potentially as a result of the bankruptcy filing by Toys’R’Us as well as a rotation to electronics as gifts. Automotive imports also did poorly, with a 3.2% reduction tracking the downturn in sales of imported vehicles.
Among industrial products imports of iron and steel surged 7.7% after a small reduction the prior month. Continued delays in implementing the section 232 reviews of the industry by the Commerce Department have left the window open for suppliers to continue building inventory. Continued business confidence – and consumers’ appetite for electronics and appliances – drove the imports of electrical and electronics equipment 8.5% higher. That was the 18th increase in the past 19 months for the sector.

Source: Panjiva
Going into the last month of the year the conditions for growth look robust. Business surveys remain firmly in positive territory globally, albeit with a modest reduction in optimism in the U.S. more recently. Consumer confidence meanwhile has continued to rise, and reached its highest since November 2000, Bloomberg data shows.
Finally, it looks unlikely that the administration of President Donald Trump will enact broad-based protectionist measures before year end, and even if it does (for example the section 301 review of China) the impact won’t be felt until 2018. As a consequence, and on the basis of prior year’s patterns, U.S. import growth in 2017 overall could reach 3.8% (upgrade from 3.4% last month) or 11.56 million shipments.

Source: Panjiva
]]>
Shipments from Asia soared, with Chinese exports by sea to the U.S. climbing 7%. That may reflect a desire among exporters to avoid forthcoming protectionist measures from the Trump administration. A similar effect can be see in an 8% rise in automotive imports and 5% in iron / steel. The full year may see growth of 3% based on prior year patterns, with the stakes in the peak season being raised by further weather-based disruptions including Hurricane Irma.
U.S. seaborne imports increased by 2.1% on a year earlier in August, Panjiva data shows. That was the sixth straight increase, and resulted in a new record of 1.07 million shipments. The growth rate was the slowest in nearly a year, likely reflecting disruptions late in the month from Hurricane Harvey. As outlined in Panjiva research of August 29 this may have cut imports by around 6,500 TEUs per day, or 0.6% of the monthly total.

Source: Panjiva
That is not to say that Harvey had no effect. Imports that head into the U.S. east coast dropped, including a 1.9% slide in shipments from the European Union – the first drop since December 2015 – and a 12.9% slump in those from Mexico by sea. Meanwhile shipments from Asia went from strength to strength. Imports from China climbed 6.9% and shipments from South Korea jumped 6.2%, possibly reflecting concerns about hawkish commentary on tariffs and trade deals from President Donald Trump.
Source: Panjiva
A similar pattern can be seen in tariff-sensitive sectors including autos (7.5% higher in the traditional slow month for the year) and iron/steel (which increased 4.7%). The latter represented a sixth straight rise, confirming the cost of delay in decision-making regarding the administration’s section 232 reviews of the steel and aluminium sectors.
Discretionary consumer goods meanwhile saw a downturn, with apparel falling 1.7% and toys by 8.5%, though furniture continued to buck the trend with a 10.5% rise.

Source: Panjiva
Looking ahead to the full year growth of 3.2% to reach 11.5 million shipments should be possible, based on prior year’s patterns. These have typically included shipments in September that are lower than August – reflecting the timing of the peak shipping season. Last year the pattern was distorted by the failure of Hanjin Shipping at the end of August. This year Hurricane Irma may have a similar effect – it may disrupt 10,600 TEUs per day – raising the stakes for the shipping industry in October.

Source: Panjiva
This report first appeared in Panjiva Research on 9/11 – please email sales@panjiva.com for more details.
]]>
U.S. seaborne import shipments climbed 5.7% on a year earlier in July, Panjiva data shows, breaching the 1 million shipment mark for only the second time (previous being August 2016) ever. That also marks the 11th year-over-year increase in the past 12 months. The increase shouldn’t be a surprise – American managers’ import expectations have reached their highest since November 2014, as outlined in Panjiva research of August 1.

Source: Panjiva
While that would suggest few concerns about increased tariffs or protectionist measures in the very near term, there is still significant import growth in tariff-sensitive sectors. Imports in the automotive industry remaining startling, with a 19.8% growth in shipments coming despite a steady slide in auto sales. Iron and steel shipments also continued to expand, rising 9.8%. That was the fifth straight monthly increase, and comes as the administration of President Donald Trump continues to consider the results of the section 232 review of the industry.
Retailers may be relying on stronger consumer spending broadly, reflecting consumer confidence reaching a 16 year high according to the Conference Board survey. Imports of consumer durables are improving, as evidenced by a 15.1% increase in furniture imports to the second highest ever. Notably imports of apparel increased by 1.3% following a protracted downturn. Less positively the first month of the pre-holiday season toy imports was down 12.4%.

Source: Panjiva
Vietnam’s ascent as a manufacturing powerhouse was in evidence, with a 28.4% growth rate nearly doubling the prior month’s level. That brought it to an all-time high, and within 2% of India’s level, which itself climbed by a respectable 9.8% rate. We continue to see Vietnam as being at risk of being a target of the Omnibus report on the causes of the trade deficit, the results of which are now more than a month overdue.
Imports from Greater China meanwhile accounted for three quarters of the expansion in absolute terms with a 10.2% rise. That was faster than the U.S. total for seventh straight month (excluding lunar new year). If repeated in the dollar value of exports then increased friction between the two countries’ governments seems likely, especially if the U.S. government launches a section 301 review.

Source: Panjiva
If the “shape” of imports so far this year can be taken as a guide to how the peak season may look, then this year so far looks no different to prior years. The real proof will come in August and September data. As well as simply covering more of the year, they will also show how much of last year’s “flattening” later in the peak season was due to Hanjin Shipping’s failure. On the basis of prior years 57.2% of full year shipments are complete by the end of July. that would suggest shipments in 2017 will be 3.1% higher than a year earlier, or 11.48 million shipments.

Source: Panjiva
]]>The import boom being experienced by the United States showed no signs of letting up in May. Panjiva data shows that, on a preliminary basis, seaborne import shipments increased 3.9% on a year earlier. That was the third straight month of growth, and the 10th increase in the past 12 months. A further expansion in imports would follow a 9% expansion in the value of imports in April, which in turn resulted in a 24% rise in the trade deficit, as outlined in Panjiva research of June 5.
Source: Panjiva
Segmenting imports by country of origin shows the fastest growth among the largest shippers to the U.S. came from India with a 15.5% growth rate. That was the fastest rate of growth since June 2015. That is notable as India is one of the few countries that has not yet had a heads-of-state meeting with President Donald Trump so far.
Shipments from China continued to expand, though the 6.50% growth rate was a marked slowdown from the previous two months. The expansion may prove counterproductive as China and the U.S. round out their first 100 days of trade talks on July 16 – the full May trade deficit data will be released 10 days earlier. Meanwhile China was singled out in comments about the most recent trade deficit report by Commerce Secretary Wilbur Ross.
Exports from the European Union may finally be slowing down. Imports increased by 1.42%. That was the 17th straight month of growth, but the slowest rate since May 2016. Such a slow-down may ease the pressure in tariff-deficit politics between the U.S. and the EU, though talks to revive the TTIP trade deal seem unlikely anyway.
Source: Panjiva
The potential “race to beat tariffs” seen in imports at the product level in April appears to have continued in May. Imports of autos and parts increased for a second month, and accelerated to 22.0% higher than a year earlier. That came despite a continued slowdown in the sales of imported vehicles. It seems increasingly likely that inventories will build up, leading to discounts later in the year. Elsewhere in consumer durables, furniture imports increased 12.0% – a slower rate than the previous two months but still significant and the result of a buoyant employment market.
Among the industrials, importers of iron and steel are clearly trying to beat any broad-based tariffs resulting from the “section 232” review of the industry. That review is due to be completed by the end of June. Imports increased by 17.9% on a shipment basis.

Source: Panjiva
Looking ahead, in the previous six years around 40% of full year shipments had been completed by the end of May. Taking the year-to-date performance that would suggest seaborne imports for 2017 overall could rise 3.3% on a year earlier to a new record of 11.5 million shipments.

Source: Panjiva
]]>The U.S. import boom has continued in April, with seaborne shipments rising 9.7% on a year earlier, Panjiva data shows. That’s the fastest rate of growth since February 2016. That follows a 8.7% expansion in imports (including goods and services) in March that resulted in a 17.3% jump in the U.S. trade deficit on a year earlier as discussed in Panjiva research of May 4. A further jump in imports may increase pressure on the Department of Commerce to rapidly complete its Omnibus report on causes of the trade deficit and its review of U.S. trade deficits.

Source: Panjiva
China and the European Union were the main engines of growth, with shipments rising 16.4% and 16.1% respectively. That fits with customs data reported by China which indicated a 12% increase in the dollar value of goods shipped in April – some of which will arrive in May.
The expansion in shipments from Europe marks a return to double-digit growth, and was the fastest rate of expansion since August. Imports from South Korea – where the U.S. is threatening to renegotiate the KORUS trade deal – dropped by 10.6%, the second month of declines.

Source: Panjiva
At the product level there was a noticeable pickup in imports where there is an apparent risk of new tariffs arriving. That repeated a pattern seen in December and January. Imports of iron and steel jumped 37.1% on a year earlier, the second month of double digit growth. That likely follows the imposition of a broad-based “section 232” review of steel imports that could close the door to imports altogether.
Similar, auto industry imports (parts and completed vehicles) increased 9.0%, the first rise after six months of declines. That was led by a 40.7% increase in imports from South Korea (part of a global trend) despite falling sales, likely reflecting real anxiety at Kia and Hyundai about a cancellation of KORUS. Imports from China, mostly consisting of aftermarket parts, also climbed 26.2%.

Source: Panjiva
Full year imports could increase 3.2% on a year earlier, based on previous years’ seasonality. By end April typically 31% of full year imports have been completed, based on data since 2010. Further growth in May looks possible given the ISM survey of American managers’ import expectations hit the highest since January 2015. Meanwhile consumer confidence remains close to 15 year highs, Bloomberg reports, suggesting purchases of durables such as furnishings – imports of which which increased 33.0% in April – should continue to be robust.

Source: Panjiva
This report first appeared in Panjiva Research and the Panjiva Daily. To find out more visit panjiva.com/data/research.
]]>#1 12 Tasks for Trump’s next 100 days (April 26) We reviewed President Donald Trump’s first 100 days’ activity in trade, and identified 12 areas that need to be developed in the next 100 days. Deadlines are faced in: starting NAFTA talks (having gotten his USTR pick approved) and addressing a dispute; delivering the Omnibus trade review and implement its findings; and making good on the 100 day plan with China. He will also need to make progress in: challenging WTO legitimacy; developing concrete plans with Japan; responding to Asian trade dealmaking; addressing tax policy including BAT; and dealing with at least seven trade cases started since the beginning of the year. Finally the President may need to pay more attention to India and stay clear of European politics.
Source: Panjiva
#2 Not pushing the big red NAFTA button (April 27) After a hectic week President Trump decided not to exit NAFTA and instead renegotiate. We flagged the risk to exporters – NAFTA accounts for 34% of U.S. exports and only 19% of the U.S. trade deficit.
#3 Trump-Xi get building (April 10) President Trump’s first meeting with President Xi set the groundwork for a 100 day plan to boost U.S. exports. Easy wins could include agriculture and energy, our analysis showed, though there are plenty of hurdles ahead.
#4 Passed “peak China”? (April 4) The culmination of our monthly analysis of the U.S. trade balance showed the average trade surplus held by China vs. the U.S. hit its lowest since November 2014 on a trailing annual basis in February. The March analysis started shortly afterward – see article #16 below.
#5 Shipping consolidation marches on (April 11) Our monthly reading of U.S. inbound carriers’ market share showed the top 20 added 4.7% points to their market share on a year earlier to reach 63.1%. Controversy is starting to surround the sector though, as article #20 shows.
#6 Billion dollar sovereignty call (April 14) The NAFTA dispute panel ruled against a U.S. tariff decision on Canadian paper, while NAFTA ruled against U.S. duties on South Korean washing machines. Our calculations show the two cases cover $1.1 billion of imports and asks what the Trump administration’s reactions may be.
#7 WTO gets MES-ier (April 4) The WTO’s investigation into the EU’s treatment of China as a market economy comes after the EU applied 94 restrictions since 2008, we found. Only nine might be impacted, with a further 23 new cases needing to be reviewed.
#8 7% shipping surge seen (April 18) Our preview of the shipping industry’s earnings season found revenues could increase 7% on a year earlier, led by a 10% increase from the expeditors. Container-lines could achieve their first growth on a year earlier since 3Q 2014.
#9 Pence’s KORUS concerns (April 18) U.S. Vice President Mike Pence’s tour of Asia included a warning to South Korea that its trade deal could be reviewed. We flagged that it may need to invest more in the U.S. – its FDI is only 8% of its trade surplus, compared to 84% for Japan’s.
#10 Steel’s national security issues (April 21) The administration launched two “section 232” national security reviews during the month. The first looked at the steel industry, and could take up to 270 days to complete. We looked at 2,000 country-product pairs and found Brazil and Russia could be in Commerce’s crosshairs.
#11 Aluminum’s national security issues (April 27) The second “232” review was into aluminum. Our deep-dive showed Canada, Russia, the UAE and China are potential targets. Targeting Canada may clash with NAFTA while Chinese foil is already under investigation.
#12 Ross swings the axe (April 25) Commerce Secretary Wilbur Ross launched surprise (at least in timing) tariffs on Canadian softwood lumber exports, rather than waiting for a ruling on June 23. Our data showed Canadian exports to the U.S. already fell 16% in February from their peak.
#13 Schenker shoots ahead (April 11) Our monthly review of non-vessel operating common carriers (NVOCCs) shows the top 10 carriers’ volumes expanded 13% on a year earlier. That beat the industry average of 7%. DB-Schenker saw the fastest organic growth at 22%.
#14 NAFTA without TPA = problems (April 19) Both the Mexican and American governments appear frustrated with a lack of progress on NAFTA talks. Mexico in particular may want to avoid starting talks at the time of its seasonal peak in trade surpluses, which is normally in October.
#15 Trump’s cudgel, Xi’s Scalpel (April 3) President Trump resolved to use trade policy with China as part of attempts to rein-in North Korea. China’s imports of clothing from North Korea could be one area for sanctions, our figures show.
#16 Americans buy foreign (April 6) We take the temperature of U.S. imports each month using our shipment data, and found it was boiling over. Seaborne shipments climbed 7% for the month, with imports from China jumping 21%.
#17 China’s steel promise, delivered (April 24) Our data shows that Chinese steel export discipline had begun to fail just ahead of a government decision to withdraw 29 factories’ licenses. We also analyzed 4,000 product-country to see where the next trade cases may be hiding.
#18 Jolly bad luck for Blighty (April 24) It appears President Trump now favors a trade deal with the EU rather than the U.K. first – indeed the door was opened to TTIP talks later in the month. That should be a surprise – the U.S. runs a trade surplus of $910 million with the U.K. but a $149 billion deficit with the EU.
#19 What currency manipulation? (April 13) The U.S. Treasury Department didn’t find any countries guilty of currency manipulation, but did imply that Treasury does not believe the ECB acts in the interest of all eurozone members. We found the smallest 13 countries did more than Germany to boost the U.S. deficit.
#20 A battle for the existence of alliances (April 6) The future for shipping alliances’ exemption from U.S. antitrust rules was called into question by Congress. Our market share analysis highlighted the route-dependence of such analysis while flagging the top five shippers are twice the size of the next five.
]]>